I lost money for two years before I understood what open interest was actually telling me. I'd see price pumping, jump in long, and get liquidated in a cascade I never saw coming. The information that would have saved me was sitting right there on the derivatives dashboard the whole time — I just didn't know how to read it. Open interest is one of the few metrics in crypto that shows you what traders are actually doing with their money, not what they're saying on social media. Price tells you where the market is. Open interest tells you how much conviction — and how much leverage — is behind that price. Get good at reading the two together and you'll stop being the exit liquidity for everyone else's trade.
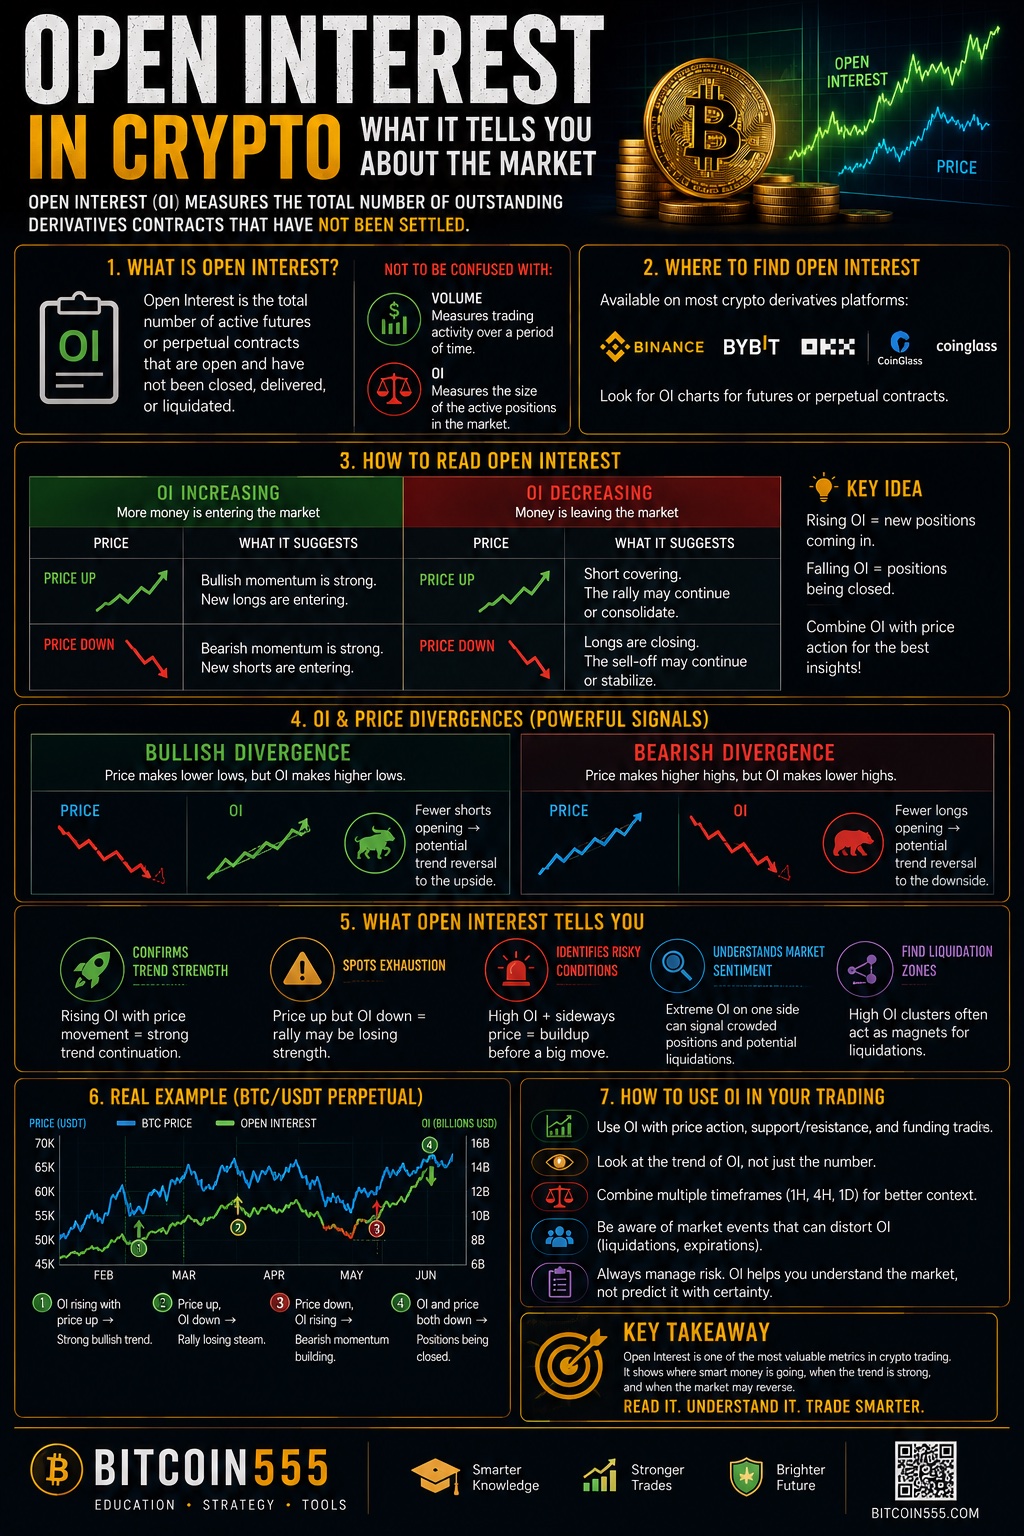
This article covers what open interest is, how it's created and destroyed, the four price-OI scenarios every trader should memorize, how to combine it with funding rates to spot squeezes, and the mistakes that cost me real money learning this stuff.
What Is Open Interest in Crypto Trading?
Open interest (OI) is the total number of derivative contracts — futures and perpetual swaps — that are currently open and have not been settled or closed. In crypto it's usually quoted in dollar terms (notional value) or in coins. If Binance shows $14 billion in BTC perpetual open interest, that means there is $14 billion worth of open long positions matched against $14 billion worth of open short positions.
That last part trips people up, so let me be blunt: for every long there is a short. Open interest is not "how many people are long." It's the total size of open positions on both sides. One long contract plus one short contract equals one unit of open interest, not two.
What open interest is NOT:
- It's not volume. Volume counts every trade executed in a period. OI counts positions still open. You can have massive volume with flat OI if traders are just passing positions back and forth.
- It's not sentiment by itself. Rising OI doesn't mean bullish or bearish on its own. It means more money and more leverage entering the market. Direction comes from reading OI alongside price.
- It's not the same across exchanges. Aggregate OI across major venues gives the cleanest picture. Single-exchange OI can be distorted by one whale or one incentive program.
Why does this matter so much in crypto specifically? Because crypto derivatives dwarf spot markets. On most days, perpetual futures volume is several times larger than spot volume. Leverage is what moves this market in the short term, and open interest is the most direct measurement of how much leverage is loaded into the system at any moment.
How Open Interest Is Created and Destroyed
Understanding the mechanics stops you from misreading the data. There are only three things that can happen when a trade executes:
- New buyer meets new seller → OI increases. Both traders are opening fresh positions. New money and new risk enter the market.
- Existing long sells to existing short (both closing) → OI decreases. Two positions are unwound. Money and risk leave the market.
- New trader takes over an existing position → OI unchanged. One position holder is replaced by another. Volume happens, but total open contracts stay the same.
This is why the direction of OI change matters more than the absolute number. A $500 million increase in OI during a price move tells you fresh positioning drove the move. A $500 million decrease tells you the move was fueled by traders closing or getting liquidated — which is a fundamentally different market condition, even if the candles look identical.
Liquidations are the most important destruction mechanism in crypto. When an overleveraged long gets liquidated, the exchange force-sells the position. That's a market sell that closes an open contract — OI drops and price gets pushed down simultaneously. When thousands of these fire at once, you get a liquidation cascade: price waterfalls, OI collapses, and within minutes billions in leverage gets flushed out. If you've ever watched Bitcoin drop 8% in twenty minutes on no news, you've watched open interest being destroyed in real time.
The Four Price-OI Scenarios Every Trader Should Memorize
This is the core framework. Price can go up or down, and OI can rise or fall alongside it. That gives four combinations, and each one tells a different story about market structure.
1. Price up + OI up = New longs driving the move
Fresh money is opening long positions and pushing price higher. This is the healthiest form of an uptrend in derivatives terms — new conviction is entering. But there's a limit: if OI rises much faster than price, the market is getting crowded and leveraged. A trend built on rapidly expanding OI is a trend loading its own fuel for a squeeze.
2. Price up + OI down = Short covering
Price is rising because shorts are closing (buying back), not because new buyers are stepping in. Short-covering rallies can be violent, but they're structurally weak — once the shorts are done covering, the buying pressure evaporates. These rallies frequently retrace most of their gains. When I see price ripping higher while aggregate OI bleeds off, I do not chase. Ever.
3. Price down + OI up = New shorts driving the move
Fresh money is opening shorts and pressing price lower. Trend continuation is likely in the near term, but the same crowding logic applies in reverse: aggressive OI expansion on the way down builds the fuel for a short squeeze. Some of the most brutal upside wicks in crypto history happened after price grinded down for days on rising OI.
4. Price down + OI down = Long liquidation / deleveraging
Longs are closing or being liquidated. This is the flush. It's painful to sit through, but it's often the most constructive thing that can happen in a market — leverage resets, weak hands are cleared, and spot buyers regain control. Some of the best long entries I've ever taken came right after a sharp price drop accompanied by a 15–25% collapse in open interest.
Memorize these four. When you can glance at a price chart and an OI chart side by side and instantly know which regime you're in, you're reading the market at a level most retail traders never reach.
Open Interest + Funding Rates: Spotting the Squeeze
Open interest tells you how much leverage is in the system. Funding rates tell you which side is paying to hold it. Combine them and you can identify crowded trades before they blow up.
Quick refresher: perpetual futures use funding payments to keep the contract price tethered to spot. When funding is positive, longs pay shorts — meaning longs are the aggressive, crowded side. When funding is negative, shorts pay longs.
The setups I watch for:
- High OI + strongly positive funding (0.05%+ per 8 hours) + price stalling: Longs are crowded, paying heavily to stay in, and price has stopped rewarding them. This is a long-squeeze setup. One decent push down triggers stop-losses and liquidations, and the cascade feeds itself. I either take profit on longs, tighten stops, or look for a short entry on a break of structure.
- High OI + negative funding + price holding support: Shorts are crowded and paying to press a market that won't go down. This is short-squeeze fuel. A reclaim of a key level can rip through short liquidation clusters and produce a violent upside move.
- OI grinding to new highs while price chops sideways: Leverage is building without resolution. Expect a large, fast move soon — direction unknown, but the move will be big because there's a lot of leverage to unwind on whichever side is wrong.
Notice that none of this predicts direction with certainty. What it predicts is fragility. Crowded, leveraged positioning breaks violently. Your job is to avoid being part of the crowd and, when possible, position for the break.
A Real-Numbers Example: Trading the Deleveraging Flush
Here's a setup I trade a few times a year. The numbers are illustrative but realistic.
The context: Bitcoin has rallied from $52,000 to $61,000 over three weeks. Aggregate perpetual OI has grown from $11 billion to $16.5 billion — a 50% increase against a 17% price move. Funding has been printing 0.06–0.09% per 8 hours for days. Longs are crowded and paying through the nose. I'm flat, waiting.
The trigger: Price breaks a support shelf at $59,500 and cascades. Within four hours, BTC wicks down to $55,800 and OI collapses from $16.5B to $13.2B — roughly 20% of open interest destroyed. Funding flips to negative. The liquidation heatmap shows the big long clusters below $58,000 have been cleared out. That combination — sharp price drop, massive OI destruction, funding reset — tells me the flush has largely completed. This is scenario 4 resolving.
The trade:
- Account size: $20,000, risking 1% per trade = $200 max loss.
- Entry: $56,900 on the first higher low after the wick, once OI stabilizes (stops falling) for a couple of hours.
- Stop-loss: $55,600, below the flush low. Stop distance = $1,300, about 2.3%.
- Position size: $200 risk ÷ $1,300 stop distance = 0.153 BTC, roughly $8,700 notional. On 3x leverage that's about $2,900 of margin — the leverage just determines margin efficiency, not risk. Risk is defined by the stop.
- Target: $60,800, back toward the pre-flush range. Reward = $3,900 per BTC → R:R of 3:1.
The outcome logic: If I'm right, price recovers as spot buyers step in against a deleveraged market, and I make roughly $600. If I'm wrong and the flush was the start of a bigger breakdown, I lose $200 and move on. I need to win this setup only about 25% of the time to break even at 3:1; historically, post-flush recoveries after 20%+ OI destruction win far more often than that. But I've also eaten the stop plenty of times — deleveraging events sometimes come in waves, and the second flush takes out the first flush's low. That's why the position size is small and the stop is non-negotiable.
The mirror setup: The same framework works in reverse. When price grinds up on collapsing OI (short covering, scenario 2) into a resistance level with funding flipping positive, I'll fade the move with a short — tight stop above the covering high, targeting the origin of the squeeze, sized to the same 1% risk. Chasing short-covering rallies long is one of the most reliable ways to lose money in this market; fading them, carefully, is one of the more reliable ways to make it.
Two practical notes. First, I execute these trades on Binance because it has the deepest perpetual liquidity, which matters when you need fills during volatile flushes. Second, my long-term Bitcoin stack has nothing to do with any of this — it sits in cold storage on a Ledger hardware wallet and never touches a derivatives account. Keeping trading capital and long-term holdings physically separated is the single best risk-management decision I've made. If leveraged trading isn't for you, systematic spot accumulation is a legitimate alternative — you can model what regular buying would have done historically with a DCA calculator.
Common Mistakes Traders Make With Open Interest
These are the errors I made myself or watch newer traders make constantly:
- Treating rising OI as bullish by default. OI is direction-neutral. Rising OI in a downtrend means shorts are pressing, not that "money is flowing in" bullishly. Always read OI relative to price.
- Confusing OI with volume. High volume with flat OI means positions are churning hands — no new conviction either way. High volume with rising OI means genuine new positioning. These are very different signals.
- Ignoring the denominator. Dollar-denominated OI rises automatically when price rises, even if no new contracts open. Check coin-denominated OI (BTC terms) to see whether positioning actually grew or the number just inflated with price.
- Reading one exchange in isolation. A single venue's OI can be skewed by one large player or a trading competition. Use aggregated OI across major exchanges for market-wide reads.
- Using OI as a standalone entry signal. OI tells you about market structure and fragility. It doesn't give you an entry price. You still need levels, structure, and a defined stop. "OI is high so I shorted" is not a trade plan — I've blown weeks of profit learning that crowded trades can stay crowded far longer than your margin survives.
- Trading the middle of an OI expansion. The best OI-based trades happen at extremes: after violent OI destruction (flush entries) or at record OI with extreme funding (squeeze setups). In the middle of the range, OI is mostly noise.
- Forgetting that squeezes work both ways. Traders love hunting short squeezes and forget long squeezes are just as common. If you're long in a market with record OI and rich positive funding, you are the squeeze fuel.
FAQ: Open Interest in Crypto
Where can I check crypto open interest data?
Most major derivatives exchanges publish their own OI, and Binance shows it directly in its futures interface. For aggregated cross-exchange data, analytics platforms like Coinglass, CoinGlass-style dashboards, Laevitas, or CryptoQuant show combined OI, funding rates, and liquidation data. For serious use, watch aggregated OI in both USD and coin terms.
Is high open interest bullish or bearish?
Neither, on its own. High OI means a lot of leverage is in the system, which means larger and faster moves when positions unwind. Direction comes from context: whether OI is rising or falling relative to price, and which side is paying funding. High OI is best read as a fragility indicator, not a directional one.
What does a sudden drop in open interest mean?
Positions are being closed en masse — usually through liquidations or panic exits. A sharp OI drop during a price crash is a long flush; during a price spike, it's a short squeeze resolving. Large OI resets (15%+ in hours) often mark local exhaustion points, because the leverage that was fueling the move has been destroyed.
Does open interest work the same for altcoins as for Bitcoin?
The mechanics are identical, but altcoin OI is thinner and easier for single players to distort. A whale can meaningfully move OI on a mid-cap perpetual. The signals still work — crowded funding plus elevated OI on an altcoin often precedes brutal squeezes — but use wider stops and smaller size, because the moves are more violent and the data is noisier.
What's the difference between open interest and funding rate?
Open interest measures how much leveraged positioning exists. Funding rate measures which side is crowded and paying for the privilege. OI is the size of the loaded spring; funding tells you which direction it's compressed. Together they're far more powerful than either alone.
Conclusion: OI Is a Map of Leverage, Not a Crystal Ball
Open interest won't tell you where price is going tomorrow. What it will tell you — with more honesty than any influencer or headline — is how much leverage is in the market, whether the current move is built on fresh conviction or forced unwinding, and when positioning has become so crowded that the market is primed to break violently in one direction.
Learn the four price-OI scenarios until they're reflexive. Combine OI with funding rates to spot crowded trades. Trade the extremes — the flushes and the squeezes — not the noise in the middle. Size every position off a hard stop, because even the best OI read fails regularly, and the whole point of this framework is surviving the times you're wrong.
And keep your worlds separate: trade with defined risk on a liquid venue like Binance, and keep your long-term holdings offline on a Ledger where no liquidation engine can ever touch them. The traders who last in this market aren't the ones who read every signal perfectly — they're the ones still standing after everyone else got flushed.
Disclaimer: This article is for educational purposes only and is not financial advice. Trading cryptocurrencies involves substantial risk of loss. Never trade with money you cannot afford to lose.