Most retail traders stare at candlestick charts all day and never once open the order book. That's like driving while only looking in the rearview mirror. The chart shows you what already happened. The order book shows you what traders are willing to do right now — where real money is stacked, where liquidity is thin, and where price is likely to accelerate or stall. I've been trading crypto for years, and I can tell you honestly: learning to read market depth didn't turn me into a wizard, but it stopped me from making dozens of dumb entries into obvious walls and slippage traps. This guide covers how order books actually work, how to spot manipulation like spoofing, and how to build real trade setups around depth — with concrete numbers, not vague theory.
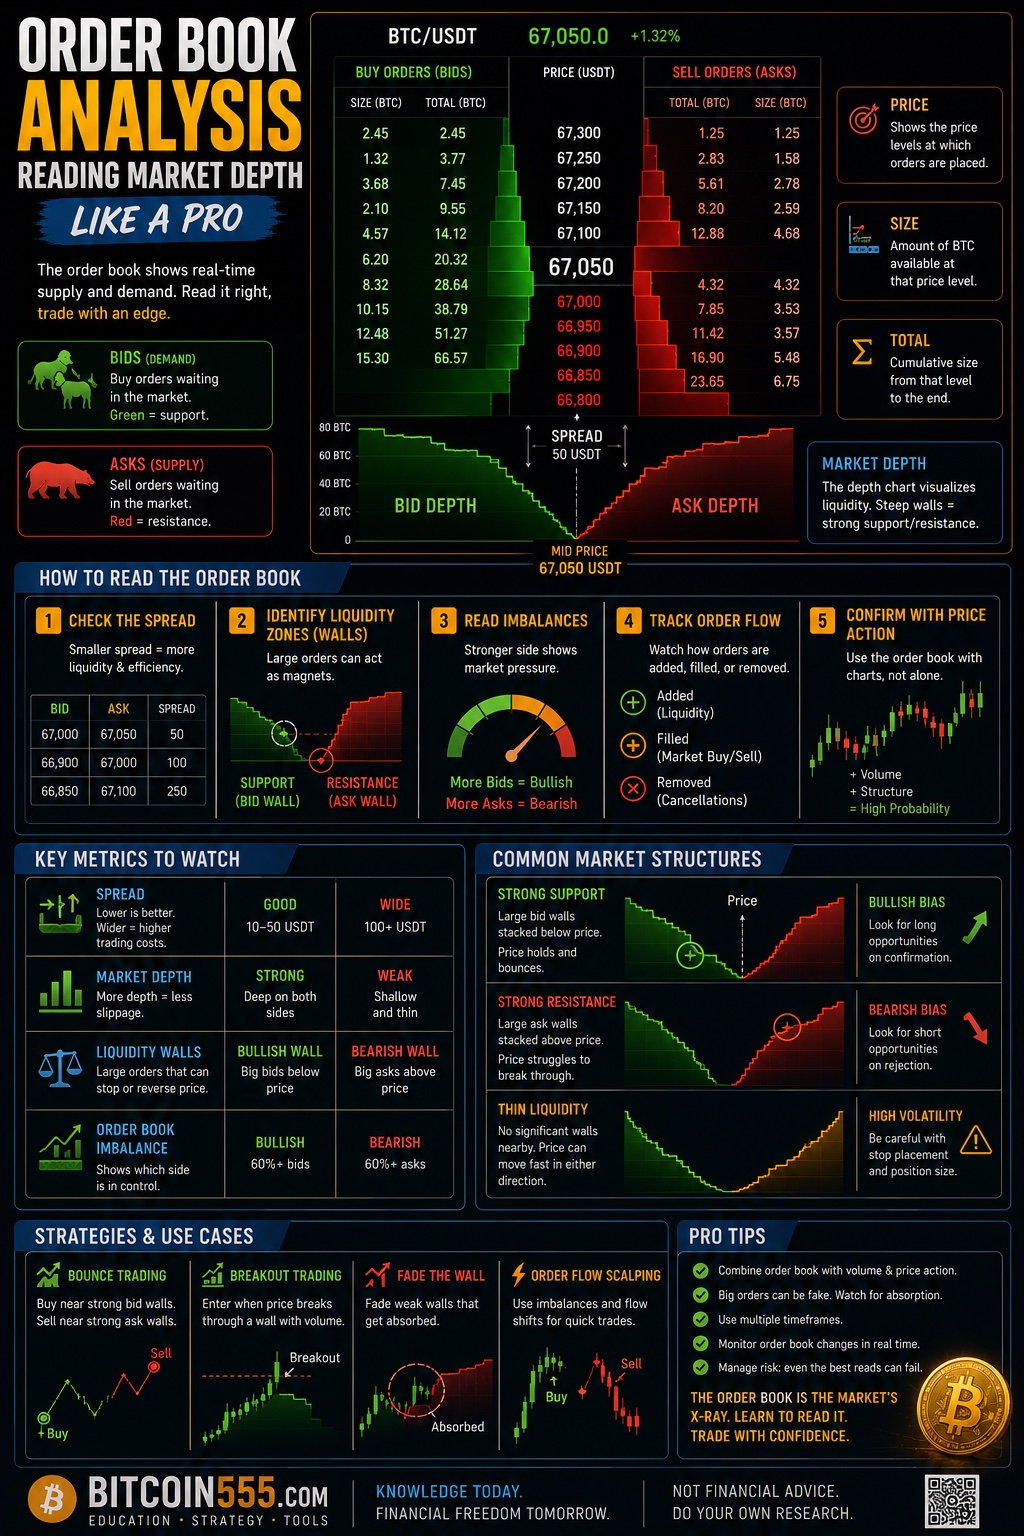
What an Order Book Actually Shows (And What It Doesn't)
An order book is a live list of all resting limit orders on an exchange for a given trading pair. It has two sides:
- Bids — buy limit orders below the current price. Traders saying "I'll buy if price comes down to here."
- Asks (offers) — sell limit orders above the current price. Traders saying "I'll sell if price comes up to here."
The gap between the highest bid and the lowest ask is the spread. On a liquid pair like BTC/USDT on Binance, the spread is often a few cents to a couple of dollars. On a low-cap altcoin, it can be 0.5% or more — and that spread is a hidden cost you pay on every round trip.
Here's the part beginners miss: the order book only shows passive intent. It shows limit orders sitting on the book. It does not show:
- Market orders — the aggressive buyers and sellers who actually move price. They only appear on the tape (time and sales) at the moment of execution.
- Hidden and iceberg orders — large orders deliberately split so only a small slice is visible at a time.
- Orders that will be pulled — a limit order costs nothing to place and nothing to cancel. Much of what you see can vanish in milliseconds.
So the order book is not a crystal ball. It's a map of possible supply and demand that changes constantly. The skill is separating real liquidity from noise and theater.
Reading Market Depth: Bids, Asks, and Liquidity Zones
Most exchanges display a depth chart — a visual of cumulative bid and ask volume at each price level. On Binance you'll find it next to the standard order book view. Here's how I read it in practice:
Cumulative depth tells you about slippage
Say BTC is trading at $58,400 and the depth chart shows $4.2 million of cumulative bids between $58,400 and $58,000, but only $1.1 million of asks between $58,400 and $58,800. That's a lopsided book. If a $2 million market buy comes in, it will chew through the thin ask side and push price up fast. The same $2 million market sell would barely dent the bid side. Thin sides of the book are where price moves fast; thick sides are where it grinds.
Clusters, not single levels
One large order at a single price is suspicious (more on spoofing below). What I trust more is a cluster — say, 15–40 BTC of bids spread across $58,150 to $58,250 from what looks like many different orders. Clusters are harder to fake and usually represent genuine accumulation interest.
Depth imbalance ratio
A quick heuristic I use: compare bid volume vs ask volume within 1% of the current price. If bids outweigh asks by 2:1 or more, short-term pressure leans bullish — price tends to drift toward the thin side. It's not a signal on its own, but it's a useful tiebreaker when a chart setup is borderline. Just remember: this ratio can flip in seconds, so it confirms entries, it doesn't generate them.
Walls, Spoofing, and Fake Liquidity: Don't Get Played
This is where most new order book readers get burned. They see a 300 BTC sell wall at $60,000 and think, "Price can never break that." Then the wall gets pulled two seconds before price reaches it, price rips through, and they've shorted into a breakout.
How spoofing works
Spoofing is placing large orders you never intend to fill, to manipulate other traders' behavior. A whale who wants to buy cheaply might place a huge visible sell wall to scare retail into selling, absorb those sells with hidden bids, then cancel the wall. It's illegal in regulated markets and against the rules on major exchanges, but it still happens, especially on smaller venues and low-cap pairs.
How to tell real walls from fake ones
- Watch what happens when price approaches. A real wall gets eaten — you see executions printing on the tape as market orders fill against it. A fake wall gets pulled or "walks away," constantly re-placing itself a few ticks further from price.
- Real walls attract volume. If a bid wall at $58,200 is genuine, you'll often see other traders front-run it, placing bids at $58,210–$58,230. Liquidity attracts liquidity.
- Persistence matters. A wall that has sat for hours and partially filled multiple times is far more meaningful than one that appeared 90 seconds ago.
- Check multiple exchanges. Genuine institutional interest at a level usually shows up across Binance, Coinbase, and derivatives venues simultaneously. A wall on one small exchange only is almost certainly noise.
My honest rule after getting spoofed more times than I'd like to admit: never trade against a wall, and never rely on a wall as your only reason to enter. Use walls as context, and use price action plus the tape as confirmation.
Order Flow: The Tape Doesn't Lie
The order book shows intent; the tape (time and sales) shows action. Every trade that prints is a market order hitting a limit order. Reading them together is where order book analysis becomes genuinely useful.
Key patterns I watch:
- Absorption. Price sits at a bid cluster, aggressive sellers keep hammering it with market sells (red prints on the tape), but price doesn't drop and the bids keep refilling. Someone big is absorbing supply. This is one of the most reliable bottoming signals I know at a support level.
- Exhaustion. A rapid string of large market buys pushes price into an ask wall, prints slow down, the wall barely shrinks. Buyers are running out of ammunition. Often precedes a pullback.
- Sweep and reclaim. A large market order sweeps through a level, triggering stops, then price immediately reclaims the level as the book refills. Classic liquidity grab — and often a great entry in the opposite direction of the sweep.
On Binance, the trade history panel and depth view give you enough for this on liquid pairs. For serious order flow work, dedicated footprint/DOM tools help, but honestly, 80% of the edge comes from simply watching how the book and tape behave at levels you already care about.
A Real Trade Setup Using Market Depth (With Numbers)
Theory is cheap, so here's how I'd actually structure a trade around order book information. This is a long setup on BTC/USDT, spot or low-leverage perpetuals.
The setup
- Context: BTC pulls back to a prior daily support zone around $58,000–$58,300 after an uptrend. The chart level alone is interesting but not enough.
- Order book confirmation: A persistent bid cluster of roughly 35 BTC sits between $58,150 and $58,280, refilling as it gets hit. On the tape, aggressive market sells are being absorbed — price holds $58,200 despite heavy red prints for 20+ minutes.
- Ask side: Thin liquidity above until roughly $59,600, where a modest offer cluster sits. That's my magnet and target zone.
The execution
- Entry: $58,350 — I don't try to bid inside the cluster and hope; I enter once absorption is confirmed and price ticks up off the zone.
- Stop loss: $57,900 — below the entire bid cluster. If those bids get eaten and price trades under $58,000, my thesis is simply wrong. Risk per BTC: $450.
- Target: $59,700, just in front of the visible ask cluster (never target exactly into a wall — you want your order filled before everyone else's). Reward per BTC: $1,350.
- R:R: 3:1.
- Position size: On a $10,000 account risking 1% ($100): $100 ÷ $450 = 0.222 BTC. That's roughly $12,950 notional, so on spot you'd scale the account or use modest leverage on a perpetual — the dollar risk stays exactly $100 either way.
Notice what the order book contributed here: it didn't create the trade — the chart level did. It confirmed the entry (absorption), defined the invalidation (below the cluster), and refined the target (in front of the ask wall). That's the correct role of depth analysis. When this trade fails — and roughly 4 out of 10 of these do fail for me — the loss is one clean R, not a disaster.
A quick short example
Same logic in reverse on ETH/USDT: persistent ask cluster $3,245–$3,260 that has rejected price twice, with sellers absorbing market buys. Short entry $3,240, stop $3,262 (above the cluster, $22 risk), target $3,180 in front of a bid shelf ($60 reward). R:R about 2.7:1. Risking $100 means a position of roughly 4.5 ETH. Small, defined, repeatable.
Where Order Book Analysis Fits in Your Overall Strategy
Let me be blunt about limitations, because most articles on this topic oversell it:
- Order book edges are short-term. Depth information is useful for entries, exits, and intraday reads. It tells you almost nothing about where BTC will be in six months.
- You're competing with machines. High-frequency firms read the book in microseconds. Your edge isn't speed — it's patience: waiting at pre-defined levels for confirmation the bots can't fake for long (sustained absorption, persistent clusters, multi-exchange agreement).
- Fees and slippage eat scalpers alive. If your average winner is 0.4% and you pay 0.1% per side in taker fees, half your edge is gone before slippage. Use limit orders (maker fees) whenever the setup allows.
This is also why I keep my trading capital and long-term capital completely separate. Active order book trading happens on the exchange — Binance's depth tools and liquidity are as good as it gets for retail. But coins I intend to hold for years never sit on an exchange; they go to a Ledger hardware wallet, offline, where no exchange hack or account freeze can touch them. Trade on the exchange, store in cold storage — that separation has saved a lot of traders' careers.
And if you find, after a few months of honest record-keeping, that your active trading underperforms simply buying on a schedule — you won't be alone, most traders discover exactly that. Run the numbers on systematic accumulation with our free DCA calculator and compare it against your trading P&L. The comparison is humbling for most of us, and it's better to know.
Common Mistakes When Reading Order Books
- Trading walls as if they're guaranteed support or resistance. Walls get pulled. Always wait for the tape to confirm the wall is being defended before leaning on it.
- Ignoring the tape entirely. The book without the tape is half the picture. Passive orders show intent; executed trades show commitment.
- Reading depth on illiquid pairs. On a coin doing $200k daily volume, one market maker's algorithm IS the order book. Depth analysis only works where many independent participants compete — stick to top pairs.
- Staring at the top 5 levels only. The best-bid/best-ask flickers constantly and is dominated by bots. Zoom out to depth within 0.5–2% of price for a meaningful read.
- Overtrading because the book "looks bullish." Depth imbalances flip constantly. If you enter every time bids outweigh asks, you'll churn your account into fees. The book confirms setups; it doesn't replace them.
- Placing your target exactly at a big wall. Thousands of traders see the same wall. Front-run it by targeting slightly before the level, or you'll watch price reverse three ticks from your take-profit. I learned this one the expensive way — a 2.8R winner turned into a breakeven scratch because I was greedy for the last $15.
- Forgetting that stops in the book are invisible. Stop orders don't appear in market depth until triggered. Zones just beyond obvious support/resistance are liquidity pockets where cascades happen. Expect sweeps there; don't be the stop that gets harvested at the obvious round number.
FAQ: Order Book and Market Depth Questions
Is order book analysis better than technical analysis?
Neither — they answer different questions. Charts tell you where important levels are; the order book and tape tell you how the market is behaving at those levels right now. The traders I know who consistently profit use both: structure from the chart, timing and confirmation from the book.
Can I see whale orders in the order book?
Sometimes, but assume sophistication. Large players use iceberg orders (showing only a slice at a time), hidden orders, OTC desks, and algorithmic execution that slices a 500 BTC order into thousands of small fills. What you can detect is their footprint: bids that keep refilling at a level, or absorption that doesn't match the visible size. Behavior reveals whales better than raw order size does.
What's the difference between market depth and volume?
Volume is historical — trades that already executed. Market depth is prospective — limit orders currently resting on the book. Depth can evaporate instantly (orders are free to cancel); volume is permanent record. High volume at a price level is generally more trustworthy evidence of interest than a big number sitting on the book.
Does spoofing still happen on major exchanges?
Yes, though less blatantly than years ago. Major exchanges monitor for it and regulated venues prosecute it, but flashing orders and layering still occur, especially on altcoins and during low-liquidity hours. Protect yourself by never acting on a single large order and always demanding tape confirmation.
Do I need paid tools to read order flow?
No. For crypto, the free depth chart, order book, and trade history on Binance cover the essentials for liquid pairs. Dedicated DOM/footprint software adds convenience and granularity for full-time scalpers, but if you can't extract an edge from the free tools first, paid software won't save you.
Conclusion: Depth Is Context, Not a Crystal Ball
Reading order books won't make you clairvoyant, and anyone selling it that way is lying to you. What it will do — if you put in the screen time — is make you a more precise trader: better entries at levels you already identified, stops placed beyond real liquidity instead of arbitrary percentages, and targets that get filled instead of missed by three ticks. Start small: pick one liquid pair, watch the book and tape at your key levels for a few weeks without trading, and journal what actually happens when walls appear, get eaten, or get pulled. The pattern recognition builds slowly, then compounds. Keep your risk at 1% per trade, demand at least 2:1 reward-to-risk, keep long-term holdings offline on a hardware wallet like a Ledger, and let the order book do the one job it's genuinely good at: showing you where the money is standing right now.
Disclaimer: This article is for educational purposes only and is not financial advice. Trading cryptocurrencies involves substantial risk of loss. Never trade with money you cannot afford to lose.