I'll say something that sounds arrogant but is simply what I've seen after years of trading crypto: most traders who talk about risk-reward ratio don't actually understand it. They quote "never take less than 1:2" like it's scripture, they draw targets on charts to make the math work, and then they wonder why their account bleeds out over six months despite "only taking good setups." The risk-reward ratio isn't the problem. The way people calculate it is.
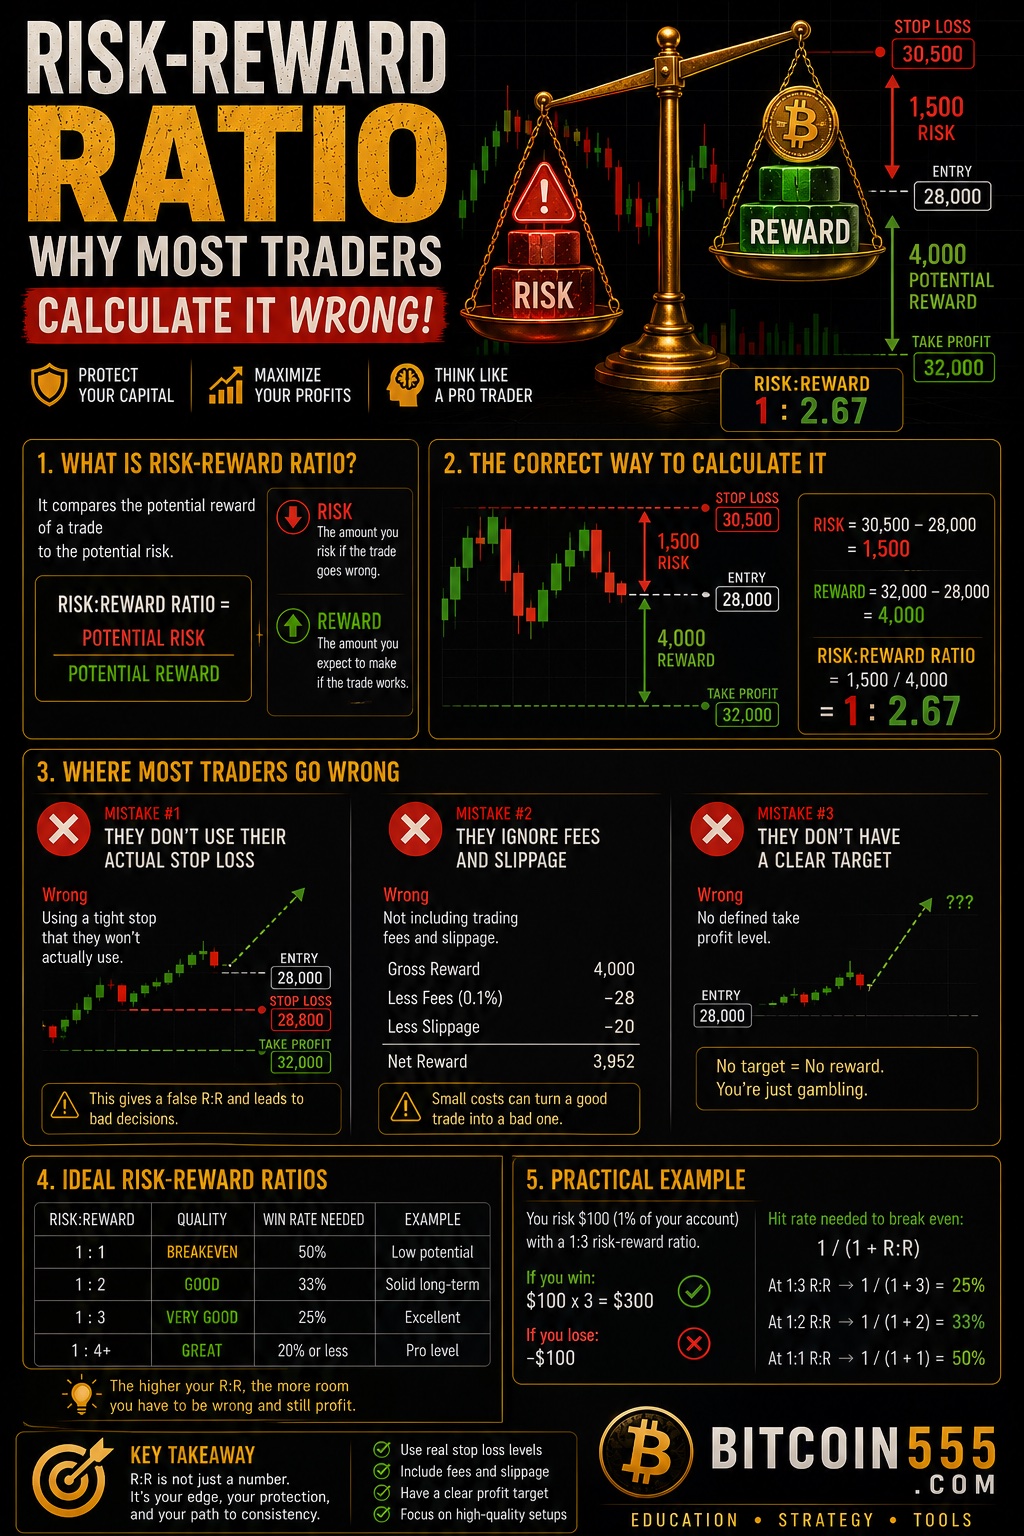
This article breaks down where the calculation goes wrong, why a beautiful 1:3 ratio on paper can still be a losing trade, and how to build R:R into a system that actually survives contact with the market. Real numbers throughout, because vague advice is what got most traders into this mess in the first place.
What Risk-Reward Ratio Actually Measures
The definition is simple. Risk-reward ratio compares what you stand to lose if your stop loss is hit against what you stand to gain if your target is hit.
Basic example on Bitcoin:
- Entry: $60,000
- Stop loss: $58,800 (risk of $1,200 per BTC)
- Take profit: $63,600 (reward of $3,600 per BTC)
- Risk-reward ratio: $1,200 risked to make $3,600 = 1:3
So far, so obvious. Here's the part that trips people up: the ratio says nothing about the probability of either outcome happening. A 1:3 ratio means nothing if your target only gets hit 15% of the time. This is where the entire calculation starts to fall apart for most traders, because they treat R:R as a standalone quality metric when it's only one variable in a two-variable equation.
The other variable is win rate, and the two are locked together whether you acknowledge it or not.
The Win Rate Connection Most Traders Ignore
Your expectancy — the average amount you make or lose per trade over time — is what determines whether you're profitable. The formula is straightforward:
Expectancy = (Win rate × Average win) − (Loss rate × Average loss)
Let's run it with real numbers. Say you risk $100 per trade and consistently take 1:3 setups, so your winners pay $300.
- At a 30% win rate: (0.30 × $300) − (0.70 × $100) = $90 − $70 = +$20 per trade. Profitable.
- At a 20% win rate: (0.20 × $300) − (0.80 × $100) = $60 − $80 = −$20 per trade. Losing system.
Same "excellent" 1:3 risk-reward ratio. One version makes money, the other loses it. The ratio alone told you nothing.
Now flip it. A trader taking 1:1 setups with a 60% win rate: (0.60 × $100) − (0.40 × $100) = +$20 per trade. Identical expectancy to the 1:3 trader with 30% wins. Neither approach is "better" — they're just different trade-offs between how often you win and how much you win when you do.
Here's the honest breakeven table every trader should have memorized:
- 1:1 ratio needs a win rate above 50% to profit
- 1:2 ratio needs above 33.3%
- 1:3 ratio needs above 25%
- 1:5 ratio needs above 16.7%
The mistake isn't taking low-ratio trades. The mistake is not knowing your actual win rate, which means you have no idea whether your ratio requirements make any sense. Most traders have never tracked 100 trades in a journal, so they're guessing at half of the equation.
The Backwards Calculation: Where It All Goes Wrong
Here's the core problem, and if you take one thing from this article, make it this: most traders calculate risk-reward backwards. They decide they want a 1:3 trade, then move their stop and target around until the chart gives them one.
The correct order of operations is:
- Stop loss goes where the trade idea is invalidated. Below the swing low, beyond the range, under the level that made you interested in the first place. This is dictated by the market structure, not by your desired ratio.
- Target goes where price realistically has a reason to go. A prior high, a major resistance zone, a liquidity area. Also dictated by the chart.
- Only then do you calculate the ratio. If the honest stop and the honest target produce 1:2.5, great. If they produce 1:0.8, you skip the trade. You don't fix the numbers — you find a different trade.
What traders actually do is the reverse. They see an entry they like, slap a stop loss tight enough to make the ratio look good, and stretch the target to a level price has no business reaching in that market environment. The result is a trade that looks like 1:4 in the journal and behaves like a coin flip with terrible odds in reality.
A concrete example of the backwards calculation
Ethereum is trading at $3,000 after bouncing from a swing low at $2,880. A trader wants a 1:3 setup, so they set:
- Entry: $3,000
- Stop: $2,970 (a 1% stop, placed nowhere meaningful — just tight enough to make the math pretty)
- Target: $3,090
On paper: risking $30 to make $90. Beautiful 1:3. In practice, that $2,970 stop sits inside normal intraday noise. ETH routinely wicks 1-2% without any change in structure. The stop gets hunted, the trader is out for a loss, and price then rallies to $3,090 exactly as predicted. The analysis was right. The calculation was wrong.
The honest version of that trade:
- Entry: $3,000
- Stop: $2,860 (below the actual swing low with a small buffer — the point where the bounce thesis is genuinely dead)
- Target: $3,090 (real resistance overhead)
Now it's risking $140 to make $90 — roughly 1:0.64. That's a bad trade, and knowing it's a bad trade before entering is the entire point. The honest calculation didn't ruin a good setup. It revealed that the setup was never good.
How to Calculate Risk-Reward Correctly, Step by Step
Here's the full process I use on every trade, with numbers. Assume a $10,000 account and a rule of risking 1% per trade — $100 maximum loss on any single position.
Step 1: Define invalidation first
Say Bitcoin has broken out above a range high at $64,000 and retested it. My thesis is that the breakout holds. The thesis is invalidated if price closes back inside the range — call it $62,700 with a buffer below the retest low. That's my stop. Not negotiable, not adjustable to improve the ratio.
Step 2: Define a realistic target
The next significant resistance is the prior high at $68,000. I'm not targeting $75,000 because it makes the ratio prettier — I'm targeting where price has an actual historical reason to stall.
Step 3: Calculate the ratio
- Entry: $64,200 (on the retest confirmation)
- Stop: $62,700 → risk of $1,500 per BTC
- Target: $68,000 → reward of $3,800 per BTC
- Ratio: 1:2.53
My tracked win rate on breakout-retest setups sits around 42%. Breakeven at 1:2.53 requires roughly 28%. This trade clears the bar comfortably, so it's a take.
Step 4: Size the position from the risk, not from the account
Position size = account risk ÷ per-unit risk = $100 ÷ $1,500 = 0.0667 BTC, roughly $4,280 of exposure at entry. If I'm trading this on Binance with the stop placed as a hard order — not a mental one — the worst realistic outcome is a $100 loss plus a bit of slippage. If it hits target, I make about $253.
Notice the position size fell out of the math. I didn't decide to "put $4,000 into this trade." The stop distance and my fixed risk decided for me. Wider stop, smaller position. Tighter stop, larger position. Same $100 at risk every time. This is the mechanism that lets you survive losing streaks, and losing streaks are guaranteed — a 40% win rate system will hand you five losses in a row regularly, and eight in a row eventually. At 1% risk, eight straight losses is a 7.7% drawdown. Annoying. At 10% risk per trade, it's a 57% drawdown and probably the end of your trading.
Fees, Slippage, and Funding: The Silent Ratio Killers
Here's another place the standard calculation quietly lies to you: it ignores costs. In crypto, costs are not trivial, especially on shorter timeframes.
Take a scalp: entry $60,000, stop $59,700, target $60,600. On paper that's risking $300 to make $600 — a clean 1:2. Now add reality on a typical spot fee of 0.1% per side:
- Round-trip fees on a $6,000 position: roughly $12
- Slippage on stop-market execution during a fast move: easily another $15–30 on a position this size in volatile conditions
Your real numbers become something like: risk $335, reward $588. The ratio drops from 1:2 to about 1:1.75. That doesn't sound catastrophic until you remember the breakeven win rate just moved from 33% to 36%. If your true win rate is 35%, fees alone converted a winning system into a losing one — and you'd never see it in your chart analysis, only in your account balance.
On perpetual futures, add funding rates for anything held more than a few hours. A trade held through three funding intervals at 0.03% each is another 0.09% shaved off. The shorter your timeframe and the tighter your stops, the more costs dominate. This is why so many scalpers with "good ratios" lose money: their calculated R:R and their realized R:R are two different numbers.
Fix: calculate your ratio after estimated costs. If a setup only works before fees, it doesn't work.
Common Risk-Reward Mistakes That Drain Accounts
Beyond the backwards calculation, these are the errors I see constantly — and have made myself, expensively.
1. Moving the stop loss to "give the trade room"
You planned to risk $100. Price approaches your stop, you widen it, and now you're risking $180 on a trade whose ratio was calculated on $100. Every ratio and expectancy number in your system is now fiction. A moved stop isn't risk management; it's hoping with extra steps.
2. Taking profit early and calling it discipline
The mirror image. You planned 1:3, price hits 1:1, you panic-close to "lock it in." Do this consistently and your system that needed a 25% win rate now needs 50% — but your entries were only ever selected to clear 25%. Cutting winners short while letting your full stop-outs run is how traders manufacture a negative expectancy from a positive one.
3. Ignoring the actual probability of the target
A 1:6 setup targeting a level price hasn't touched in months, through three major resistance zones, is not a better trade than a 1:1.8 setup targeting the next obvious level. Ratio without probability is half a number.
4. Using percentage-based stops instead of structure-based stops
"I always use a 2% stop" means your stop placement has nothing to do with when your trade idea is wrong. Sometimes 2% is inside the noise, sometimes it's needlessly wide. Structure decides the stop; the stop decides the size.
5. Averaging down on losers
Adding to a losing position destroys your original R:R calculation entirely. Your risk grows, your invalidation point blurs, and a planned $100 loss becomes an unplanned $600 one. If you want to accumulate an asset at progressively lower prices, that's a long-term investing strategy, not a trade — do it deliberately with a plan, not as damage control. If accumulation is actually your goal, run the numbers with a DCA calculator and keep that capital completely separate from your trading account.
6. Trading with your long-term stack
Related and underrated: keep trading capital and long-term holdings in different places, physically and mentally. Coins you intend to hold for years shouldn't sit on an exchange tempting you to "just take one trade." Move long-term positions to a Ledger hardware wallet in cold storage, and let your exchange balance be only the money whose job is trading. This single separation has saved more accounts than any indicator ever will.
Frequently Asked Questions
What is a good risk-reward ratio for crypto trading?
There isn't a universally "good" one — there's only one that fits your win rate. If your tracked win rate is 45%, ratios of 1:1.5 and up work fine. If you trade breakouts that win 30% of the time, you need 1:2.5 or better just to have margin above breakeven. The honest answer: track at least 50–100 trades in a journal, learn your real win rate per setup type, then set your minimum ratio with a comfortable buffer above the breakeven requirement.
Is a higher risk-reward ratio always better?
No. Stretching targets to inflate the ratio lowers the probability of the target being hit, which can reduce expectancy overall. A realistic 1:2 with a 45% win rate (expectancy +$35 per $100 risked) beats a fantasy 1:5 with a 12% win rate (expectancy −$28). The ratio and the win rate move against each other; your job is to find the combination that maximizes expectancy, not the biggest number on one side.
Should I calculate R:R before or after fees?
After. Always. Fees, slippage, and funding are real money that comes out of every trade. On higher timeframes with wide stops they matter less; on scalps they can flip a system from profitable to losing. Estimate round-trip costs and subtract them from your reward and add them to your risk before deciding whether a setup qualifies.
How much should I risk per trade?
Most experienced traders risk 0.5%–2% of their account per trade, with 1% being a sensible default. The number matters less than the consistency: fixed fractional risk is what makes your R:R statistics meaningful and what keeps a normal losing streak from becoming an account-ending drawdown. Risking 10% per trade with a 1:3 ratio isn't aggressive trading — it's a countdown.
Does risk-reward ratio apply to long-term investing too?
The concept applies but the mechanics differ. Long-term holders don't typically use hard stops; their risk management is position sizing, time horizon, and self-custody. If you're accumulating rather than trading, focus on consistent buying and secure storage rather than per-trade ratios — and again, keep that stack off exchanges and on a hardware wallet.
Final Thoughts: The Ratio Is a Filter, Not a Strategy
Risk-reward ratio is one of the few genuinely useful concepts in trading, which is exactly why it gets mangled so badly. Used correctly, it's a filter: the market shows you a setup, you place the stop where the idea dies and the target where price has a real destination, and the resulting ratio tells you whether the trade is worth taking given your actual win rate. Used incorrectly — targets stretched, stops squeezed, fees ignored, win rate unknown — it's a way to feel disciplined while losing money.
The uncomfortable truth is that fixing your R:R calculation won't make trading easy. You'll still take losses, still hit drawdowns, still watch trades stop out by a few dollars before reversing. What honest calculation does is guarantee that your edge, if you have one, actually shows up in your account balance instead of leaking away through fictional ratios and inconsistent sizing. Calculate stop first, target second, ratio third, size last. Track everything. Keep trading capital on the exchange and long-term holdings in cold storage. That's the boring, unglamorous system that's still standing after the traders chasing 1:10 setups have blown up and left.
Disclaimer: This article is for educational purposes only and is not financial advice. Trading cryptocurrencies involves substantial risk of loss. Never trade with money you cannot afford to lose.