I've been staring at TradingView charts for the better part of a decade, and I can tell you one thing with certainty: the platform won't make you profitable, but a bad setup will absolutely make you unprofitable. I've watched traders lose money not because their analysis was wrong, but because their charts were a mess of fifteen indicators, their alerts never fired, and they were reading price data from a dead exchange feed. This guide is everything I wish someone had handed me on day one — how to set up TradingView for crypto properly, which indicators actually earn their place on a chart, and how to turn all of it into trades with defined risk. No magic indicators, no secret settings. Just the workflow that has kept me in this game while most of the people I started with blew up.
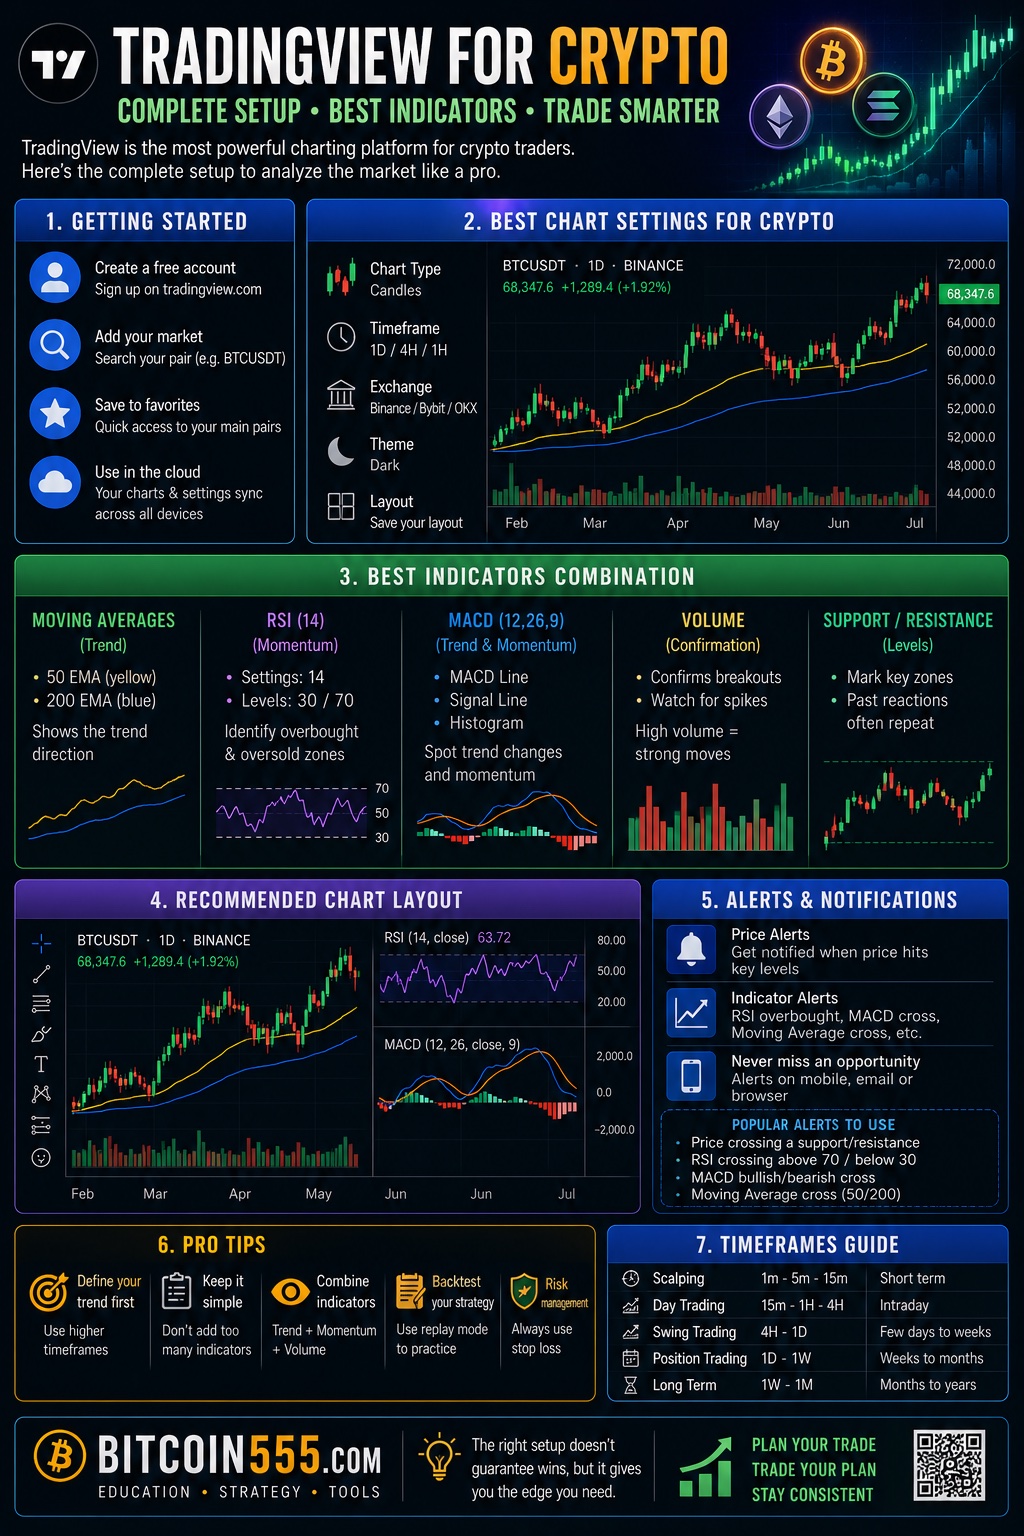
Why TradingView Is the Standard Charting Tool for Crypto Traders
There are other charting platforms, but TradingView won the crypto market for practical reasons. It aggregates price feeds from virtually every major exchange — Binance, Coinbase, Kraken, Bybit and dozens more — so you can chart the actual market you trade instead of a synthetic index. It runs in a browser, syncs across devices, and its alert system is reliable enough to build a real trading workflow around.
The free tier is genuinely usable. You get limited indicators per chart (which, honestly, is a feature — more on that later), a handful of alerts, and one chart per tab. The paid tiers add multiple charts per layout, more alerts, second-based intervals, and no ads. My honest take after years of paying for it: the Essential/Pro tier is worth it if you trade actively, mainly for the extra alerts and multi-chart layouts. The top tiers are for professionals and indicator developers. Don't let anyone tell you that you need a premium subscription to trade well. You don't.
What you actually need is a clean setup, a small set of indicators you deeply understand, and a repeatable process. Let's build that.
Setting Up TradingView for Crypto: Step by Step
1. Pick the right ticker and exchange feed
Type BTCUSDT into the search bar and you'll see the same pair listed on twenty exchanges. This matters more than beginners realize. Each feed shows that exchange's actual traded prices, and they differ — sometimes by meaningful amounts during volatile moves. The rule is simple: chart the exchange you execute on. If you trade on Binance, use the BINANCE:BTCUSDT feed. Your support and resistance levels, your wicks, your liquidation candles — they all come from that specific order book. Charting Coinbase while trading Binance means your levels are subtly wrong, and in trading, subtly wrong compounds.
For higher-timeframe analysis where you just want a long, clean price history, an index ticker like BTCUSD from a data aggregator works fine. For execution decisions, use your exchange's feed.
2. Configure the chart itself
Here's my base configuration, and the reasoning behind each choice:
- Candlestick chart, regular candles. Heikin Ashi looks smooth and seductive, but it repaints the open price and hides real entry/exit levels. Trade what actually printed.
- Log scale on weekly and monthly charts. Crypto assets move in percentage terms, not dollar terms. A move from $1,000 to $2,000 is the same as $30,000 to $60,000. Right-click the price axis and enable logarithmic scale for anything above the daily.
- UTC timezone. Crypto trades 24/7, and the daily candle close matters enormously for how everyone else reads the chart. Most of the market watches the UTC daily close. Set it in the bottom-right of the chart and stop guessing.
- Dark theme, minimal gridlines. Cosmetic, but you'll spend hundreds of hours looking at this thing. Reduce visual noise.
3. Save layouts and build a watchlist
Create one saved layout per purpose: one for high-timeframe analysis (weekly/daily), one for execution (4H/1H/15m). Then build a watchlist of 10–20 pairs maximum. I keep BTC, ETH, and a rotating set of majors. If your watchlist has 80 coins on it, you're not watching anything — you're doomscrolling with candles.
4. Set up your alert workflow early
Alerts are the single most underused TradingView feature. Instead of staring at charts waiting for price to reach your level (which leads to boredom trades — I've made hundreds of them and they were almost all losers), draw your level, right-click it, and set an alert. Connect alerts to the mobile app or email. Your job becomes: do the analysis once, set the alert, walk away, act only when the market comes to you.
The Best TradingView Indicators for Crypto Trading
Let me be blunt: every indicator is a transformation of price and volume. None of them predict anything. They organize information. Here are the ones that have survived years of me trying to remove them from my charts, and how I actually use each.
Exponential Moving Averages (EMA 21, 50, 200)
The workhorses. On the daily chart, the 200 EMA is my regime filter: price above it, I look for longs; price below it, I either look for shorts or stand aside. The 21 EMA on the 4H chart acts as dynamic support in trends — in a healthy uptrend, price repeatedly tags it and bounces, giving you defined-risk entries. I don't use crossovers as signals. The famous "golden cross" fires so late in crypto that half the move is usually gone.
RSI (14) — but for divergence, not overbought/oversold
The classic mistake is shorting because RSI hit 70. In a real crypto trend, RSI can sit above 70 for weeks while price doubles. What RSI is genuinely useful for is divergence: price makes a new high, RSI makes a lower high. That's momentum quietly dying, and combined with a resistance level, it's one of the more reliable reversal contexts in crypto. Same in reverse at lows — bullish divergence at a major support level is a setup I've traded for years.
Volume and the Volume Profile
Plain volume bars answer one question: is this move real? A breakout on 3x average volume and a breakout on declining volume are completely different trades. The Visible Range Volume Profile (available on paid tiers, with free community versions in the indicator library) goes further — it shows you at which prices the most volume traded. High-volume nodes act as magnets and support/resistance; low-volume gaps get traversed fast. When a breakout enters a low-volume zone, moves accelerate. This one indicator improved my target placement more than anything else I've added in years.
VWAP for intraday trading
If you trade below the 4H timeframe, the session VWAP (volume-weighted average price) is essential. It's the average price weighted by volume — effectively where the day's money is positioned. Price above VWAP with VWAP sloping up: intraday bulls are in control, buy pullbacks toward it. Chop around a flat VWAP: no edge, stay out. It's brutally simple and it keeps me out of more bad trades than it gets me into good ones, which is exactly what a filter should do.
ATR (14) for stop placement
Average True Range isn't a signal, it's a measuring tool, and it's how professionals size stops. If the 4H ATR on ETH is $45, a $20 stop loss is inside normal noise — you'll get wicked out on a random fluctuation and then watch the trade work without you. I place stops at least 1.5x ATR beyond my invalidation level. This alone would save most new traders a fortune in death-by-a-thousand-stopouts.
What I deliberately don't use
No Ichimoku, no five oscillators stacked in panes, no paid "buy/sell signal" indicators from social media. Especially the last category — if someone had an indicator that printed money, they wouldn't sell it for $49 a month. Most of those scripts repaint (signals change after the candle closes), making their backtests fiction. Four or five tools, understood deeply, beat fifteen tools understood superficially. Every time.
A Complete Trade Example with Real Numbers
Theory is cheap, so here's how the pieces fit together in an actual setup. The numbers are hypothetical but the process is exactly what I do.
Context (daily chart): BTC is trading above a rising 200 EMA — uptrend regime, longs only. Price has pulled back for a week toward a level at $30,000 where the Volume Profile shows a heavy high-volume node and a prior breakout occurred.
Trigger (4H chart): Price tags $30,000, prints bullish RSI divergence (price makes a marginal lower low, RSI makes a higher low), and a strong 4H candle closes back above the 21 EMA on above-average volume. That candle close is my entry signal — not the touch of the level, the reaction to it.
The trade math:
- Account size: $10,000
- Risk per trade: 1% = $100. This is the number that keeps you alive. Not 10%, not "whatever feels right."
- Entry: $30,400 (the 4H close above the EMA)
- Stop loss: $29,200 — below the swing low and roughly 1.5x the 4H ATR ($750 at the time) beyond the level. Risk per BTC: $1,200.
- Position size: $100 ÷ $1,200 = 0.083 BTC, roughly a $2,530 position. Note that position size is an output of the stop distance, never something you pick first.
- Target: $34,000 — the next low-volume gap on the profile, just under a prior high. That's $3,600 of upside against $1,200 of risk: a 3:1 reward-to-risk ratio.
Management: At $32,800 (2R in profit), I move the stop to breakeven and set a TradingView alert at the target zone. Now the worst case is a scratch. If the target hits, that's +$300 on $100 risked. If the initial stop hits, it's –$100 and I move on without emotion, because $100 was decided before I entered.
Here's the honest part: with a 3:1 R:R, this setup only needs to win about 30% of the time to break even, and mine wins somewhere in the 40–45% range over a large sample. That means I lose more trades than I win, and I'm profitable anyway. Internalize that. Most losing traders lose because they need to be right, not because their charts are worse than mine.
Execution note: I run this exact workflow charting the Binance feed and executing on Binance, so my levels match the order book I'm actually trading against. And anything I intend to hold for years never sits on an exchange at all — long-term coins go to a Ledger hardware wallet, completely separated from trading capital. Mixing the two stacks is how people end up "accidentally" trading their savings during a drawdown.
Alerts, Multi-Timeframe Workflow, and Keeping Charts Clean
A repeatable weekly routine matters more than any indicator setting. Mine looks like this:
- Sunday, weekly/daily charts: Mark the 3–5 levels that matter on each watchlist pair. Horizontal lines only. This takes an hour.
- Set alerts on every level. Right-click the line, "Add alert," done. I typically have 15–25 alerts live.
- Wait. When an alert fires, I open the 4H/1H chart and look for a trigger like the one above. No alert, no trade. This single rule eliminated most of my impulsive losses.
- Journal every trade using TradingView's screenshot tool (Alt+S). Screenshot at entry with your reasoning written on the chart, screenshot at exit. Review monthly. Painful and priceless.
On chart cleanliness: if you can't explain in one sentence why an indicator is on your chart, delete it. My execution chart has the 21/50/200 EMAs, volume, RSI, and drawn levels. That's it. Every additional pane is another voice in the room, and trading with seven conflicting voices is how paralysis and revenge trades happen.
One more workflow point that took me too long to learn: keep your trading and your long-term accumulation in entirely separate mental (and physical) accounts. Trading capital lives on the exchange and follows the 1% rule. Accumulation happens on a schedule regardless of what my charts say — if you want to see how systematic buying performs versus trying to time entries, run the numbers through a DCA calculator. For most people, that boring approach outperforms their trading. It outperformed my first two years, easily.
Common Mistakes Traders Make with TradingView
- Indicator overload. Five oscillators that all derive from the same price data don't give you five opinions — they give you one opinion in five costumes, and false confidence with it.
- Trading repainting indicators. Many free community scripts recalculate signals after candles close. The backtest looks perfect; live results are carnage. Test any script bar-by-bar with the replay tool before risking a dollar.
- Ignoring the exchange feed. Drawing levels on one exchange's chart while executing on another. Your "perfect" level was never a level on your actual order book.
- Using default settings as gospel — or endlessly optimizing them. Both extremes lose. The 14-period RSI isn't magic, but neither is the 13.5-period RSI you curve-fitted to last month's data. Pick standard settings, keep them constant, and judge the process over 50+ trades.
- Stops based on dollar pain instead of chart structure. "I'll risk $50 so my stop goes here" is backwards. The chart tells you where the trade is wrong; your position size adapts to that distance. If the correct stop makes the position too small to bother with, skip the trade.
- Screen addiction. Watching the 1-minute chart of a position you planned on the 4H is self-torture, and it ends with you closing a winner at +0.5R out of fear. Set the alerts, close the tab.
- No journal. Without screenshots and notes, you'll misremember every trade in your own favor. Your memory is your worst trading partner.
FAQ: TradingView for Crypto
Is the free version of TradingView enough for crypto trading?
Yes, for most traders starting out. The limits — fewer indicators per chart, limited alerts, one chart per layout — are workable, and the indicator cap actually enforces good habits. Upgrade when you concretely hit a wall (usually the alert limit), not before. A subscription never fixed anyone's win rate.
What is the best timeframe for crypto trading on TradingView?
There's no universal best, but there is a best structure: analyze at least one timeframe above where you execute. I plan on daily/weekly and execute on 4H/1H. Below 15 minutes, fees, spread, and noise eat most retail traders alive — I'd stay away until you're consistently profitable on higher timeframes.
Which single indicator is most useful for crypto?
If I could keep only one, it would be volume with a volume profile, because it's the only thing on the chart that isn't just a repackaging of price. It tells you where real positioning happened. But honestly, horizontal support/resistance levels — which aren't an indicator at all — matter more than anything in the indicator library.
Can I trade directly from TradingView?
TradingView supports broker and exchange integrations for direct trading on some platforms, and paper trading is built in for everyone. My suggestion: use TradingView for analysis and paper trade your system there for at least a month, then execute manually on your exchange. The extra ten seconds of friction before clicking buy has killed more of my bad trades than any filter.
Do paid signal indicators from social media work?
In my experience, no. Most repaint, most are moving-average mashups with arrows painted on, and all of them sell certainty in a business that has none. The $50/month would be better spent on losing it slowly in small live trades — at least those lessons stick.
Conclusion: The Chart Is a Tool, Not an Oracle
TradingView is the best charting platform in crypto, and after everything above, here's the uncomfortable summary: the setup takes an afternoon, the indicators take a few weeks to understand, and the discipline takes years. Chart the exchange you trade on, use log scale and UTC closes, run a handful of indicators you genuinely understand — EMAs for regime, RSI for divergence, volume for confirmation, ATR for stops — and let alerts bring the market to you instead of chasing it. Size every position from your stop distance, risk 1% or less, and journal ruthlessly.
Nothing in this article will stop you from having losing trades. I have them every week. The point of a proper TradingView setup is that your losers are small, planned, and survivable, while your winners are allowed to run to targets you chose with a clear head on a Sunday afternoon. That asymmetry — not prediction — is where trading profit actually comes from. Keep your trading stack on the exchange, keep your long-term coins on a hardware wallet, keep your charts clean, and give yourself enough time to be bad at this before you're good at it. Everyone pays tuition to this market. The setup above just keeps the tuition affordable.
Disclaimer: This article is for educational purposes only and is not financial advice. Trading cryptocurrencies involves substantial risk of loss. Never trade with money you cannot afford to lose.