I lost more money trading breakouts in my first two years than with any other strategy. Not because breakout trading doesn't work — it does — but because I was buying every candle that poked above resistance like it was free money. It took roughly forty stopped-out trades and one blown swing account before I understood the uncomfortable truth: most breakouts fail. Depending on the market conditions, somewhere between 50% and 70% of breakout attempts in crypto turn into fakeouts. The traders who make money from breakouts aren't the ones who catch every move. They're the ones who filter ruthlessly, size correctly, and accept that a losing trade taken with a good process is still a good trade.
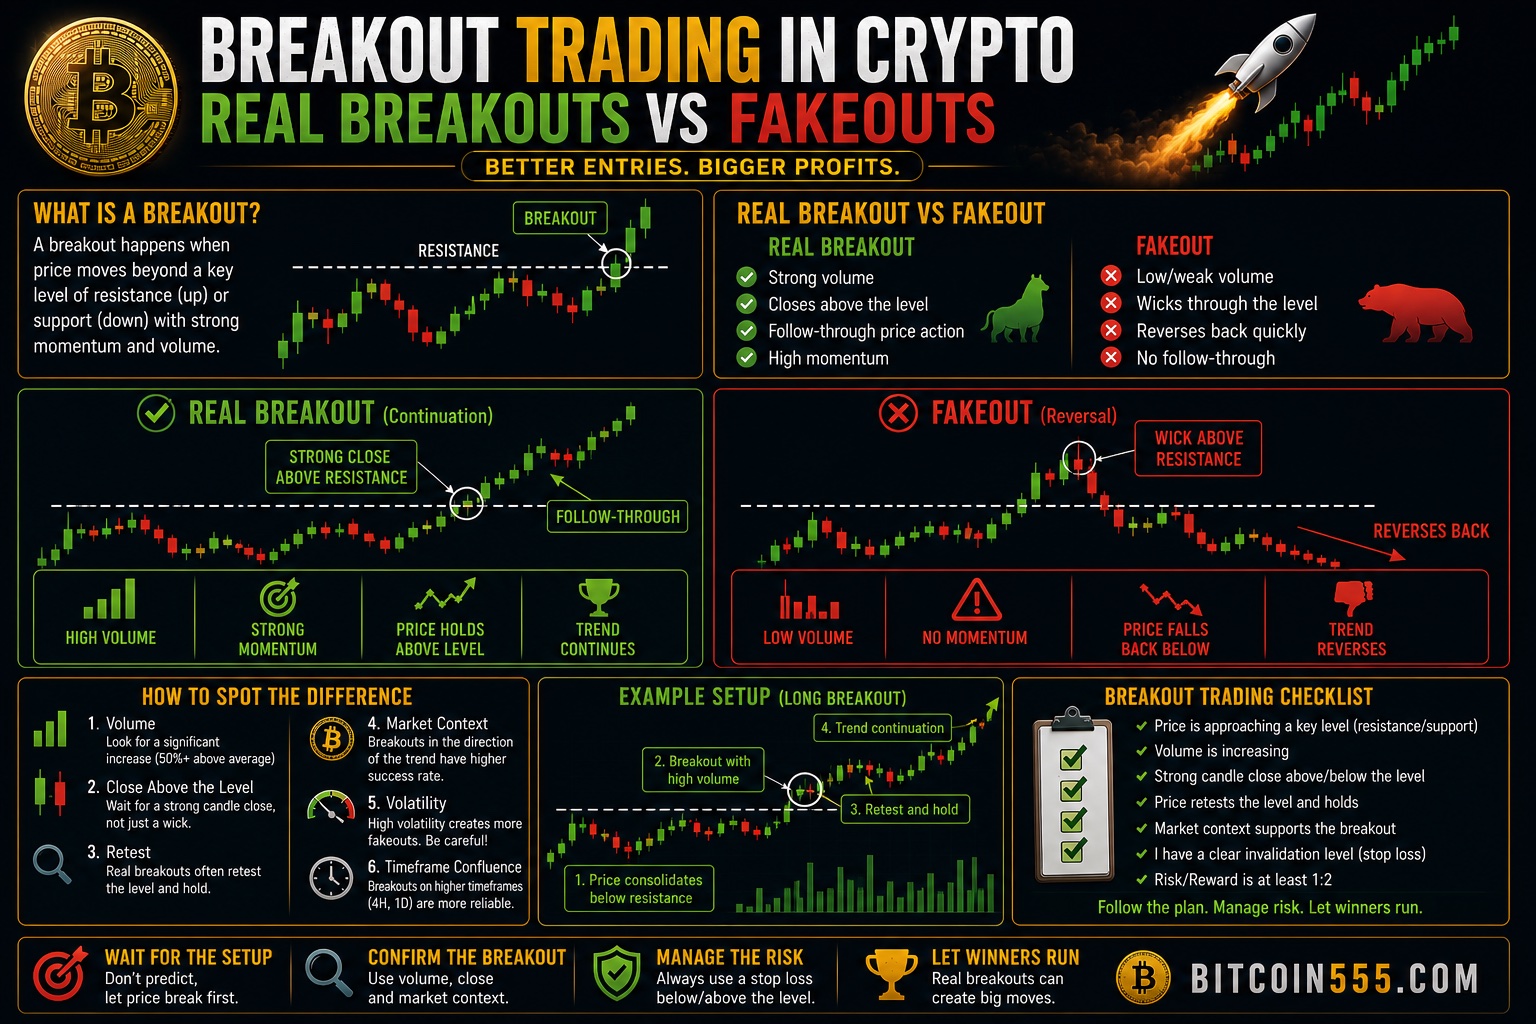
This article is everything I wish someone had told me before I started chasing green candles. We'll cover what a real breakout actually looks like, the specific confirmation signals I use, how to structure entries and stops with real numbers, and the mistakes that quietly drain accounts.
What Is Breakout Trading and Why Crypto Is Both Perfect and Brutal for It
Breakout trading means entering a position when price moves through a significant level — resistance, support, a trendline, or the boundary of a consolidation pattern — with the expectation that momentum will carry price further in the direction of the break. It's one of the oldest strategies in trading, and crypto markets are almost custom-built for it. Crypto trends hard. When Bitcoin or a major altcoin genuinely breaks out of a multi-week range, the follow-through can be 20%, 40%, sometimes 100% or more. That kind of trend persistence is rare in traditional markets.
But here's the brutal part: crypto is also the fakeout capital of the financial world. The market trades 24/7, liquidity is thinner than in equities or forex, and large players know exactly where retail stop losses and breakout orders cluster. Stop hunts — where price spikes through an obvious level, triggers a wave of orders, and immediately reverses — are not a conspiracy theory. They're a structural feature of a market where a single large order on a major exchange like Binance can push price through a level and trap thousands of breakout buyers in seconds.
So the question isn't "should I trade breakouts?" The question is "how do I distinguish the breakouts worth trading from the traps?" That's a filtering problem, and filters are exactly what the rest of this article delivers.
The Anatomy of a Real Breakout: Four Signals That Actually Matter
After years of trading these setups, I rely on four confirmation signals. No single one is enough on its own. When three or four line up, my win rate on breakouts moves from a coin flip to something closer to 55–60% — which, combined with proper reward-to-risk ratios, is very profitable.
1. Volume Expansion on the Break
This is the single most important filter. A real breakout is driven by genuine buying (or selling) pressure, and that pressure shows up as volume. My rule of thumb: the breakout candle should print at least 1.5x to 2x the average volume of the previous 20 candles on the timeframe I'm trading. If price crawls above resistance on volume that's average or below, I treat it as suspect. Low-volume breakouts are how markets lure in impatient buyers before reversing.
Watch where the volume occurs, too. Volume that spikes as price approaches the level and then dies at the break is bearish. Volume that expands through and after the break is what you want.
2. A Decisive Candle Close Beyond the Level
Wicks lie. Closes tell the truth. A candle that spikes 3% above resistance and closes back below it isn't a breakout — it's a rejection, and often the best short signal you'll see all week. I wait for a full candle close beyond the level on my trading timeframe. On the 4-hour chart, that means waiting up to four hours after price first touches the level. Yes, you'll sometimes enter slightly worse. You'll also avoid the majority of intrabar stop hunts.
The close should also be decisive: the candle body should close clearly beyond the level, ideally by 0.5–1% on a 4-hour chart, not hovering a few ticks above it.
3. The Quality of the Consolidation Before the Break
The best breakouts come from the best bases. What I look for:
- Duration: at least 2–3 weeks of consolidation for swing trades. Longer bases produce stronger breakouts because more supply changes hands.
- Tightening range: volatility contracting toward the end of the range (lower highs into resistance, or a tightening triangle) shows the market coiling.
- Multiple tests of the level: resistance tested 3–5 times weakens with each test as sell orders get absorbed. A level tested once is much more likely to hold.
- Higher lows into resistance: buyers stepping in earlier each time is accumulation behavior.
4. Context: Trend and Higher Timeframe Alignment
A breakout in the direction of the higher timeframe trend succeeds far more often than a counter-trend breakout. If the daily chart is in a clear uptrend (price above the 50-day and 200-day moving averages, structure of higher highs and higher lows), a 4-hour resistance breakout has the wind at its back. If you're buying a breakout while the daily trend is down, you're fighting the market's dominant flow — sometimes it works, usually it doesn't.
Fakeout Warning Signs: How Traps Are Built
Fakeouts aren't random. They tend to share a recognizable fingerprint, and once you've seen it a hundred times, you start spotting it in real time.
- The level is too obvious and too clean. When every trader on the planet is watching a perfectly horizontal resistance at a round number, that's exactly where liquidity pools — and exactly where a sweep is most likely. Obvious levels do break for real, but they demand extra confirmation.
- Price breaks out after an extended run. A breakout that occurs after price has already rallied 30% in a week is often exhaustion, not continuation. The best breakouts launch from rest, not from euphoria.
- Momentum divergence. If price makes a new high above resistance while the RSI prints a lower high, momentum is fading into the break. That divergence doesn't guarantee failure, but it's a yellow flag I never ignore.
- Immediate stalling above the level. A real breakout should move. If price breaks resistance and then sits there for five or six candles going nowhere, buyers aren't following through, and a slide back into the range becomes likely.
- Breakouts during dead liquidity hours. Weekend breakouts and moves during low-liquidity sessions fail at a noticeably higher rate in my own trade journal. Thin order books make levels cheap to push through and cheap to abandon.
- News-driven spikes. A single headline can spike price through a level, but if the underlying structure wasn't ready, the move often retraces fully within a day or two.
One reframe changed my trading permanently: a fakeout is itself a tradable signal. When price sweeps above resistance, traps buyers, and closes back inside the range, the trapped longs become fuel for a move to the other side of the range. Some of my best short entries have been failed breakouts — the setup is often cleaner than the breakout itself.
Two Entry Methods With Real Numbers
There are two structurally sound ways to enter a breakout. I use both, depending on the setup.
Method 1: The Confirmation Entry (Enter on the Close)
You enter when the breakout candle closes beyond the level with volume confirmation. Here's a realistic example with an altcoin trading in a range:
- Setup: A large-cap altcoin has consolidated between $1.62 (support) and $1.85 (resistance) for five weeks on the 4-hour chart. Resistance has been tested four times. The last two weeks show higher lows tightening into $1.85.
- Trigger: A 4-hour candle closes at $1.88 on volume 2.1x the 20-period average.
- Entry: $1.88.
- Stop loss: $1.79 — below the breakout level and below the last consolidation swing low, giving the trade room for a normal retest. Risk per unit: $0.09, or about 4.8%.
- Position size: With a $10,000 account risking 1% ($100) per trade: $100 ÷ $0.09 = roughly 1,111 tokens, a position of about $2,089. Notice the position is only ~21% of the account — the stop distance, not the account size, dictates the position.
- Target: The measured move of the range ($1.85 − $1.62 = $0.23) projected from the breakout gives $2.08. That's $0.20 of reward against $0.09 of risk — roughly 2.2R.
At a 2.2R payoff, you only need to win about 32% of the time to break even. Win 45–50% and this is a genuinely profitable system.
Method 2: The Retest Entry (Wait for the Pullback)
Roughly half of real breakouts pull back to retest the broken level before continuing. Old resistance becomes new support. The retest entry means waiting for that pullback and entering when price holds the level.
- Setup: Bitcoin breaks a multi-week resistance at $60,000 on strong daily volume and runs to $63,500.
- The retest: Over the next three days, price pulls back to $60,400, prints a 4-hour candle with a long lower wick into the old resistance zone, and buyers step in on rising volume.
- Entry: $60,800 as price confirms the level is holding.
- Stop loss: $58,900 — clearly back inside the old range, invalidating the breakout. Risk per unit: $1,900 (~3.1%).
- Position size: $10,000 account, 1% risk = $100 ÷ $1,900 = 0.0526 BTC, roughly a $3,200 position.
- Target: $66,500 based on the measured move — about 3R.
The trade-off is real: the confirmation entry catches every breakout but eats more fakeouts. The retest entry gives you a tighter stop and better R:R but misses the breakouts that never pull back — and in strong crypto trends, the best moves often don't. My personal solution is to split the position: half on the confirmed close, half on the retest if it comes. If there's no retest, I'm still in with half size. If the retest comes, my average entry improves.
For execution, I do most of my breakout trading on Binance simply because deep liquidity matters enormously for this strategy — slippage on the entry and, more importantly, on the stop loss can quietly destroy the math on thin exchanges. And to be clear about separation of capital: my long-term Bitcoin holdings never sit on any exchange. They live on a Ledger hardware wallet, completely walled off from my trading account. Breakout trading is aggressive by nature; your long-term stack shouldn't be exposed to your trading decisions or to exchange risk.
Risk Management: The Part That Actually Keeps You Alive
Everything above is worthless without this section. Breakout trading has a losing streak problem baked into it: even with good filters, you will hit runs of five, six, seven consecutive stop-outs. The math has to survive those streaks.
- Risk a fixed percentage per trade — 1% is my ceiling for breakouts. Seven straight losses at 1% draws you down about 6.8%. Seven straight losses at 5% draws you down over 30%, and at that point most traders start revenge trading and the account spirals.
- Place stops at invalidation, not at pain tolerance. The stop belongs where the breakout thesis is dead — back inside the range, below the retest low — not at whatever dollar amount "feels" acceptable. Then size the position to fit the stop.
- Demand a minimum 2:1 reward-to-risk before entering. If the measured move or next major resistance doesn't offer at least 2R from your entry, skip the trade. There will be another one tomorrow. There always is in crypto.
- Take partial profits and trail. My standard approach: take one-third off at 1.5R, move the stop to breakeven, take another third at the measured-move target, and trail the final third under 4-hour swing lows. This banks profit while leaving room for crypto's occasional monster trends.
- Reduce size in choppy conditions. When the higher timeframe is rangebound and directionless, breakout failure rates climb sharply. I cut risk to 0.5% per trade or stop trading breakouts entirely until a trend re-establishes. Recognizing when your strategy is out of season is a skill in itself.
Common Breakout Trading Mistakes That Drain Accounts
Every one of these cost me real money before I learned it. Read the list twice.
- Buying the wick instead of the close. Entering the moment price ticks above resistance is the number one way to get trapped in a stop hunt. Wait for the candle to close.
- Ignoring volume completely. A breakout without volume expansion is a rumor, not a move. If you check nothing else, check volume.
- Chasing extended breakouts. If price closed 4% above the level and you're entering late, your stop is now huge or your R:R is ruined. Missed the entry? Wait for the retest or let it go.
- Placing stops at the obvious level. A stop one tick below broken resistance sits exactly where every other stop sits — inside the zone that normal retests routinely probe. Give the trade room below the structure, and size down accordingly.
- Oversizing because the setup "looks perfect." Perfect-looking setups fail all the time. Your conviction level is not a risk parameter. Size every trade the same way.
- Trading every range on every coin. Ten mediocre breakouts will lose more than two excellent ones will make. Filter for base quality, trend alignment, and liquidity, and let the rest pass.
- Refusing to accept the stop-out. Widening a stop mid-trade, or re-entering immediately after being stopped, turns one controlled 1R loss into a 3R hole. The stop is the trade's definition of "wrong." When it hits, you were wrong. Log it and move on.
- Not journaling. Without a trade journal, you can't know your actual breakout win rate, your average R, or which conditions kill your setups. My discovery that weekend breakouts underperformed came entirely from my journal — I'd never have noticed it by feel.
FAQ: Breakout Trading in Crypto
What timeframe is best for trading crypto breakouts?
The 4-hour and daily charts offer the best signal-to-noise ratio for most traders. Breakouts on the 5-minute or 15-minute chart are dominated by noise and stop hunts, and fees plus slippage eat a much larger share of each trade. If you're newer to the strategy, start on the daily chart — the setups are slower, cleaner, and far more forgiving.
How long should I wait to confirm a breakout is real?
At minimum, one full candle close beyond the level on your trading timeframe with above-average volume. Conservative traders wait for two closes or for a successful retest of the broken level. There's no free lunch: more confirmation means fewer fakeouts but worse average entry prices. Pick a rule, apply it consistently, and let your journal tell you whether to adjust.
Do breakout strategies work on small-cap altcoins?
They can, but the fakeout rate is meaningfully higher because thin order books make levels trivially cheap to manipulate. If you trade small caps, halve your risk per trade, demand stronger volume confirmation, and use limit orders to control slippage. Personally, I keep breakout trading to Bitcoin and liquid large-cap alts — the edge is more reliable where the liquidity is.
What win rate should I expect from breakout trading?
A realistic, well-filtered breakout system in crypto lands somewhere between 40% and 55% winners. That sounds mediocre until you remember the payoff structure: with an average winner of 2R or better, a 45% win rate is solidly profitable. Anyone promising 80% win rates on breakouts is selling something.
Should I trade breakouts to the downside too?
Yes — support breakdowns are simply the mirror image, and in crypto they often move faster than upside breakouts because fear sells harder than greed buys. The same rules apply: volume confirmation, decisive candle close, quality of the preceding consolidation, and trend alignment. Shorting requires margin or derivatives, which adds liquidation risk, so size even more conservatively.
Conclusion: Trade the Filter, Not the Excitement
Breakout trading in crypto works — but only for traders who accept its real nature. You are not trying to catch every move. You are running a filter: volume, close, base quality, trend context. Most candidates fail the filter, and most of the ones that pass will still sometimes stop you out. That's fine. The strategy's edge lives in the asymmetry — small, controlled 1R losses against 2R and 3R winners, repeated with discipline over hundreds of trades.
Start small. Trade the daily and 4-hour charts on liquid pairs, risk 1% or less per trade, journal everything, and treat your first fifty breakout trades as tuition. Keep your trading capital on a deep-liquidity venue like Binance where your stops actually fill near their price, and keep your long-term holdings offline on a Ledger hardware wallet where no trading decision — good or bad — can ever touch them. The traders who survive long enough to get good at breakouts are the ones who separated those two worlds from day one.
The market will offer you a fresh breakout setup this week. Most of them will be traps. Now you know how to tell the difference.
Disclaimer: This article is for educational purposes only and is not financial advice. Trading cryptocurrencies involves substantial risk of loss. Never trade with money you cannot afford to lose.