Here is an uncomfortable truth that took me two blown accounts to accept: your stop loss is not hidden. It sits in a cluster with thousands of other stops at obvious levels, and the biggest players in this market can see roughly where those clusters are. When price suddenly spikes through a swing low, wicks $800 below support, and then reverses violently to close green — that was not random volatility. That was a liquidity hunt. And if you learn to read liquidation maps, you can stop being the prey and start positioning on the right side of these moves.
I have traded crypto derivatives for years, and liquidation data is one of the few edges that has stayed consistently useful. Not because it predicts the future, but because it shows you where the fuel is. Price is drawn to liquidity the way fire is drawn to oxygen. This article breaks down exactly how liquidation maps work, how to read them, and how to build actual trades around them — with real numbers, real risk management, and honest talk about when this approach fails.
What Liquidation Maps Actually Show (and What They Don't)
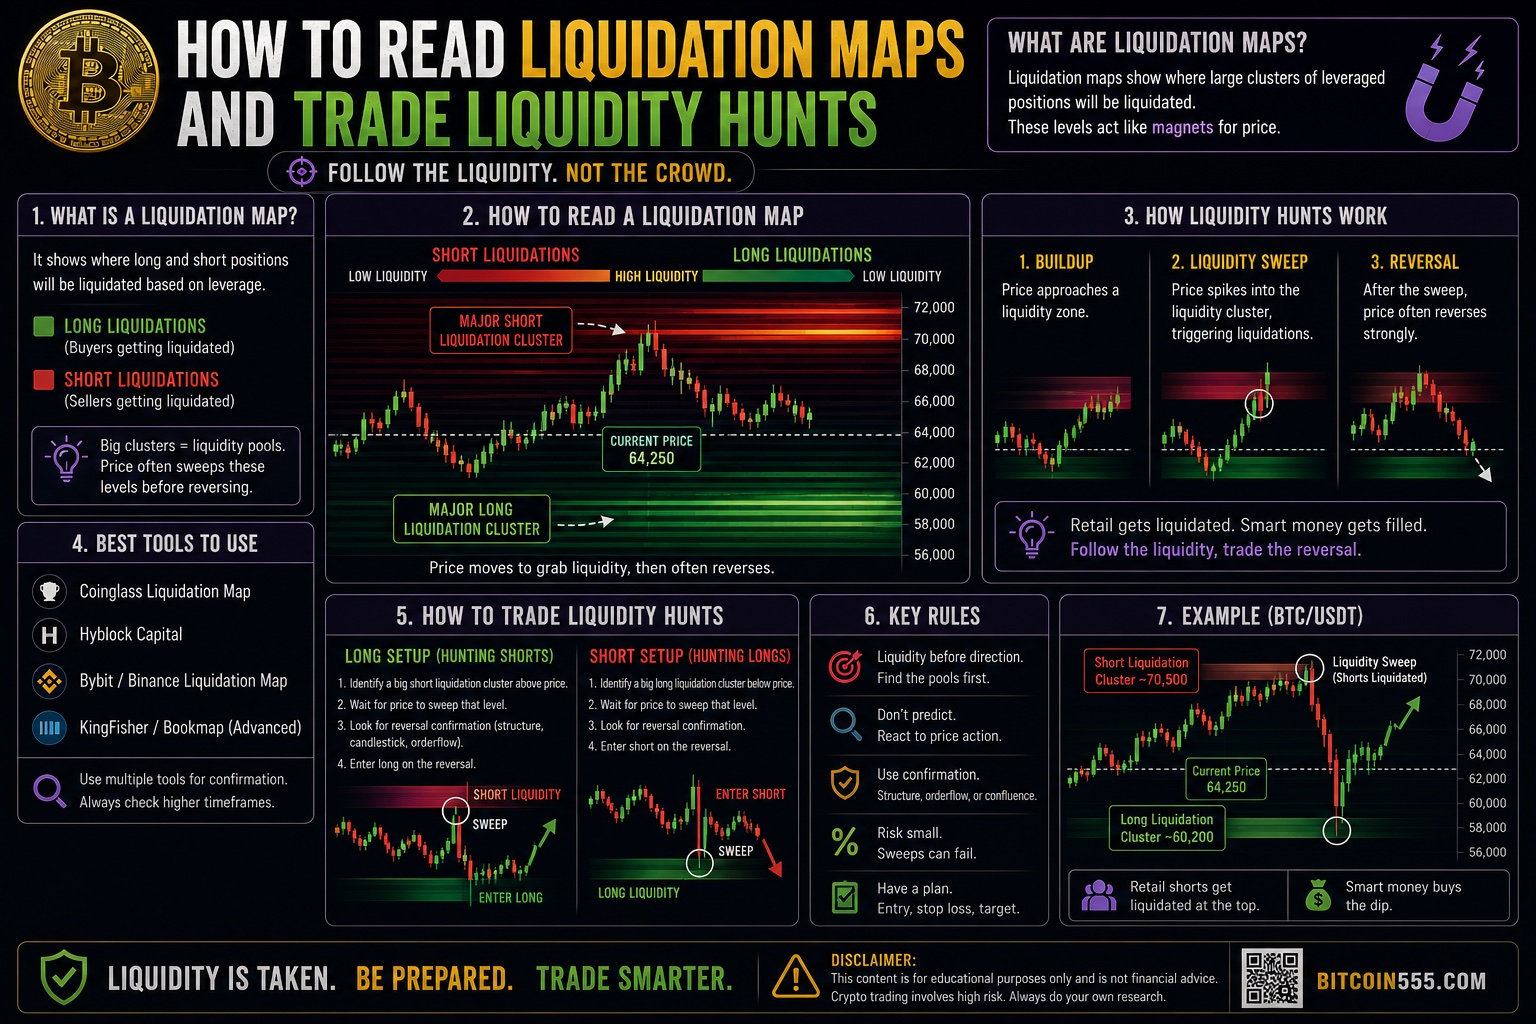
A liquidation map is a visualization of where leveraged positions are likely to be force-closed. When a trader opens a leveraged long on a perpetual futures contract, there is a specific price at which the exchange will liquidate that position. A liquidation map aggregates estimates of these levels across the market and displays them as clusters — usually bars or heat zones above and below the current price.
The mechanics are straightforward. If a trader longs BTC at $60,000 with 10x leverage, their liquidation price sits roughly 9-10% below entry, around $54,300 depending on the exchange's maintenance margin. At 25x leverage, liquidation is only about 3.7% away. At 100x, it is under 1%. Because most retail traders use high leverage and enter at similar technical levels — support, resistance, round numbers — their liquidation prices cluster together.
Here is the critical distinction most beginners miss:
- Liquidations below current price represent long positions. When price drops into these zones, longs get force-sold, which adds selling pressure — until the cluster is exhausted, at which point the selling stops abruptly.
- Liquidations above current price represent short positions. When price rises into them, shorts get force-bought back, adding buying fuel.
Now the honest part: liquidation maps are estimates, not order book data. Tools like Coinglass and Hyblock build these maps by modeling open interest changes, assuming common leverage tiers (10x, 25x, 50x, 100x), and inferring where positions were opened. They do not see individual accounts. The maps are directionally useful — the big clusters are usually real — but the exact prices can be off by a fraction of a percent. Treat them as zones, never as precise lines.
Why Price Hunts Liquidity: The Mechanics of a Stop Run
To trade liquidity hunts, you need to understand why they happen. It is not a conspiracy — it is basic market mechanics.
Large players (market makers, funds, whales) have a problem: size. If a fund wants to buy $50 million of BTC, hitting the market with that order would push price up against them, resulting in terrible average entry. What they need is a large pool of sell-side liquidity to absorb their buying. Where does forced selling appear in size? At liquidation clusters and stop-loss clusters below support.
So the sequence plays out like this:
- Price consolidates above an obvious support level. Retail longs pile in with stops just below the low. High-leverage longs have liquidation prices in the same zone.
- A large player pushes price down through the level — sometimes this only takes moderate selling because everyone's stops are stacked there.
- Stops trigger (market sells) and liquidations cascade (more market sells). This flood of forced selling is exactly the liquidity the large player needed to fill their buy order at a discount.
- Once the cluster is consumed, there are no sellers left. Price snaps back violently, leaving a long wick. The retail traders who got stopped out watch price return to — and often exceed — their original entry.
This is why the classic 'stop hunt wick' exists on every chart in every timeframe. Liquidity hunts are not occasional anomalies; they are the default behavior of leveraged markets. The liquidation map simply shows you where the next hunt is most likely to target.
How to Read a Liquidation Map Step by Step
Open a liquidation heatmap for BTC or ETH perpetuals (Coinglass is the most common free option; Hyblock offers more granularity). Here is my actual reading process, in order:
Step 1: Identify the dominant cluster
Look for the largest concentration of liquidation levels within roughly 2-5% of the current price. If price is at $61,500 and there is a massive band of long liquidations between $59,800 and $60,200, that zone is a magnet. The bigger and closer the cluster, the higher the probability price visits it.
Step 2: Compare above vs. below
Liquidity is rarely symmetric. If there are $400 million in estimated long liquidations below and only $120 million in short liquidations above, the path of least resistance — the more 'profitable' hunt for large players — is down first. I call this the liquidity imbalance, and it is the single most useful read on the map.
Step 3: Check confluence with obvious technical levels
Liquidation clusters that sit just beyond a clear swing low, a round number ($60,000, $3,000 on ETH), or a widely-watched moving average are the highest-probability targets. The hunt needs retail stops to be there too, and retail stops gather at obvious levels.
Step 4: Watch what happens when price reaches the cluster
This is where trades are made. When price sweeps into a major liquidation zone, watch for: a sharp volume spike, a long wick forming on the 5-15 minute chart, open interest dropping sharply (positions being closed/liquidated), and funding rates resetting. That combination signals the cluster has been consumed and the reversal is likely underway.
Step 5: Note which clusters survive
Sometimes price approaches a cluster and reverses before reaching it. That liquidity remains on the map and stays a target. Unswept liquidity does not expire — I have watched price return to consume a cluster three days after everyone forgot about it.
A Complete Trade Example With Real Numbers
Theory is cheap. Here is how a liquidity hunt trade actually looks, using realistic numbers on BTC perpetuals. You can execute this setup on Binance futures, which has deep enough liquidity that your fills near liquidation cascades are reliable.
The setup: BTC trades at $61,400 after three days of consolidation. The swing low of the range is $60,150. The liquidation map shows a dense long-liquidation cluster between $59,700 and $60,000 — roughly $350 million estimated. Above, short liquidations are thin until $63,500. Funding is positive at 0.015% (longs paying shorts — the crowd is long).
The read: Heavy long liquidity below, crowded long positioning, obvious support everyone can see. High probability of a sweep below $60,150 into the $59,700-$60,000 zone before any sustained move up.
The plan: I do not short into the sweep — timing that is a coin flip. Instead, I set a limit buy inside the liquidation cluster and wait for the market to come to me.
- Account size: $20,000
- Risk per trade: 1% = $200
- Entry: limit buy at $59,850 (inside the cluster, below the swing low)
- Stop loss: $59,250 — below the entire liquidation zone, because if price consumes all that forced selling and keeps falling, the thesis is dead. Stop distance: $600, or 1%.
- Position size: $200 risk ÷ $600 stop distance = 0.333 BTC ≈ $19,950 notional. On 5x leverage that requires about $3,990 margin.
- Target 1: $61,400 (back to the range) — that is $1,550 of move, roughly 2.6R. Take half off.
- Target 2: $63,300 (just below the short liquidation cluster above — never target the exact level, front-run it). That is $3,450, about 5.7R on the remainder.
How it played out in this scenario: Price broke $60,150 on a red 15-minute candle, spiked to $59,720 with a huge volume bar, filled my limit at $59,850, and reversed within 40 minutes. Open interest dropped 4% during the wick — confirmation that the cluster was liquidated. Price reclaimed $60,150 within two hours, hit Target 1 the same day, and reached $63,100 two days later where I closed the rest manually.
Result: roughly +$1,600 on $200 risked, a blended 4R winner.
Now the honest version: this exact setup fails about 40% of the time in my experience. Sometimes the sweep keeps going — the cluster gets eaten and price falls another 3% because there was real distribution behind the move, not just a hunt. That is why the stop goes below the entire zone and why I risk 1%, not 5%. Four losers in a row at 1% is annoying. Four losers at 5% risk changes your life in the wrong direction.
Trading the Short Squeeze: Hunts Work in Both Directions
Everything above mirrors to the upside. When shorts crowd in — negative funding, rising open interest on falling price, a big short-liquidation cluster overhead — the market frequently squeezes upward to consume it.
Example with numbers: ETH trades at $2,920. Funding is negative at -0.02%. The map shows $180 million in short liquidations between $3,010 and $3,060, just above the psychological $3,000 level and a prior swing high at $2,995.
- Entry: long at $2,935 on a reclaim of the local range, anticipating the magnet above
- Stop: $2,880 (below local structure) — $55 risk per ETH
- Size: $200 risk ÷ $55 = 3.6 ETH ≈ $10,560 notional
- Target: $3,045 — inside the cluster but not at its far edge. $110 of move = 2R.
The key detail: I exit into the squeeze, not after it. When price rips into a short liquidation cluster, that is where the forced buying climaxes — and where the move often ends. Selling into that spike means selling into maximum liquidity. Amateurs buy the breakout at $3,040 feeling euphoric; that is usually where I am handing them my position.
Common Mistakes That Turn This Edge Into a Loss
I have made every one of these. Learn from my tuition fees.
- Treating map levels as exact prices. The data is modeled, not observed. Enter inside zones with limit orders, and place stops beyond the entire zone — not one tick behind a bar on the heatmap.
- Fading the sweep too early. Buying the first dip into a liquidation cluster before seeing the volume climax and OI flush is how you catch a falling knife. Wait for evidence the cluster is consumed, or use resting limit orders sized so a deeper wick doesn't hurt you.
- Ignoring the higher-timeframe trend. Liquidity hunts against the daily trend snap back hard. Hunts in the direction of the trend often just... keep going. A long-liquidation sweep in a strong downtrend is frequently the start of the next leg down, not a reversal.
- Using the leverage of the people getting liquidated. The whole edge is exploiting overleveraged traders. If you run 25x yourself, you become a dot on someone else's map. I rarely exceed 5x effective leverage, and my risk per trade is fixed at 1%.
- Overtrading small clusters. A $30 million cluster on BTC is noise. Price wicks through it without reacting. I only build trades around clusters that are large relative to recent daily liquidation volumes.
- Forgetting that maps refresh constantly. A cluster you saw this morning may have migrated as traders closed positions or added margin. Re-check the map before entry, not just during your morning analysis.
- Keeping your whole stack on the exchange. Trading capital belongs on the exchange; long-term holdings do not. I keep my trading float on Binance and move core positions to cold storage on a Ledger hardware wallet. Exchange risk is real, and no liquidation-map edge compensates for losing custody of your coins.
Combining Liquidation Maps With Funding and Open Interest
A liquidation map alone is a decent tool. Combined with two other data points, it becomes a genuine edge:
Funding rates tell you which side is crowded
Sustained positive funding above ~0.03% per 8 hours means longs are paying heavily to stay in — the boat is tilted long, and the long-liquidation clusters below are richer and more likely to be hunted. Deeply negative funding flips the read. I use funding as a directional filter: I strongly prefer taking hunt-reversal longs when funding was elevated and just reset during the flush.
Open interest tells you when the hunt is complete
Open interest (OI) measures total outstanding contracts. During a genuine liquidation cascade, OI drops sharply — positions are being force-closed. If price sweeps a low but OI barely moves, the cluster was not really consumed and the level may get revisited. My rule of thumb: I want to see OI fall at least 2-3% on the flush before I trust the reversal on BTC; more on smaller alts.
The three-signal checklist
- Price sweeps into a major liquidation cluster (map)
- OI drops sharply during the move (positions flushed)
- Funding resets toward neutral (crowd punished)
When all three align with a volume spike and a rejection wick, that is an A-grade setup. I take those at full 1% risk. When only one or two conditions align, I either skip or cut size in half. Most of the improvement in my results over the years came not from finding better signals but from refusing to trade B- and C-grade versions of good setups.
FAQ: Liquidation Maps and Liquidity Hunts
Are liquidation maps accurate?
They are useful approximations. Providers model liquidation levels from open interest and assumed leverage tiers; they cannot see actual accounts. Big clusters are directionally reliable, exact prices are not. Trade zones, not lines, and always confirm with price action, volume, and open interest before committing capital.
Do whales really hunt retail stop losses?
Not in the cartoonish sense of targeting you personally. Large players need liquidity to fill size, and clustered stops plus liquidations provide it. Pushing price into those clusters is rational execution strategy, not a vendetta. The effect on your account is identical either way — so place stops beyond the obvious zones, not at them.
What leverage should I use for liquidity hunt trades?
Low. My effective leverage rarely exceeds 3-5x, and position size is always derived from a fixed 1% account risk and the stop distance — never from 'how much can I control.' The strategy profits from other people's overleverage. Using 25-50x yourself puts your liquidation price inside the very zones you are trying to trade.
Can I trade liquidity hunts on altcoins?
Yes, and the moves are often more violent because order books are thinner — but the liquidation data is less reliable and slippage is worse. I recommend mastering the approach on BTC and ETH perpetuals first, where map data is densest and fills near cascades are cleanest, before touching mid-cap alt perps.
Does this work on spot markets?
Liquidations are a derivatives phenomenon, but the price impact hits spot too since arbitrage links the markets. You can absolutely use liquidation maps to time spot entries — buying spot into a long-liquidation flush is one of the lowest-stress ways to use this data, with no liquidation risk of your own.
Conclusion: Trade the Fuel, Not the Prediction
Liquidation maps will not tell you where price is going. They tell you where the fuel is — and price needs fuel to move. Once you internalize that leveraged markets gravitate toward pools of forced orders, charts stop looking random. The wick below support that stopped you out last month was not bad luck; it was the market doing exactly what it is built to do.
The playbook is simple to describe and hard to execute: identify the dominant liquidation cluster, wait for price to sweep into it, confirm the flush with volume and open interest, enter with a stop beyond the entire zone, and risk 1% while targeting 2-5R. Expect to lose 40% of the time. Expect the losers to feel terrible and the winners to pay for them several times over. That is what a real edge looks like — statistical, boring, and profitable only with discipline.
Keep your trading capital where you trade — Binance offers the liquidation data depth and execution quality this strategy needs — and keep everything you are not actively trading offline on a Ledger hardware wallet. Survive first. The edge only compounds if you are still here next year to use it.
Disclaimer: This article is for educational purposes only and is not financial advice. Trading cryptocurrencies involves substantial risk of loss. Never trade with money you cannot afford to lose.